Educational setups

The Art of Trend Reversal: Trading’s Hidden Gem

The Art of Trend Reversal: Trading’s Hidden Gem 1500 1000 Minimalist Trading - Indicators for TradingView

The Art of Trend Reversal: Trading’s Hidden Gem

Ever wondered about the untapped potential of trend reversal trading?

If you’re looking for a strategic advantage in the financial markets, understanding the art of trend reversal could be your ace in the hole.

Best of all?

In this article, you will learn step-by-step a Profitable Trend Reversal Setup that you can use in your trading.

Is Trend Reversal Trading Profitable?

The burning question: Is trend reversal trading profitable?

The answer is a resounding “yes”, but there’s a catch—it thrives when you trade with the right indicators.

In fact, trend reversal trading isn’t about guaranteeing accurate predictions of market shifts; rather, it’s about identifying potential reversals through the use of reliable indicators and savvy analysis.

The Best Trend Reversal Indicator

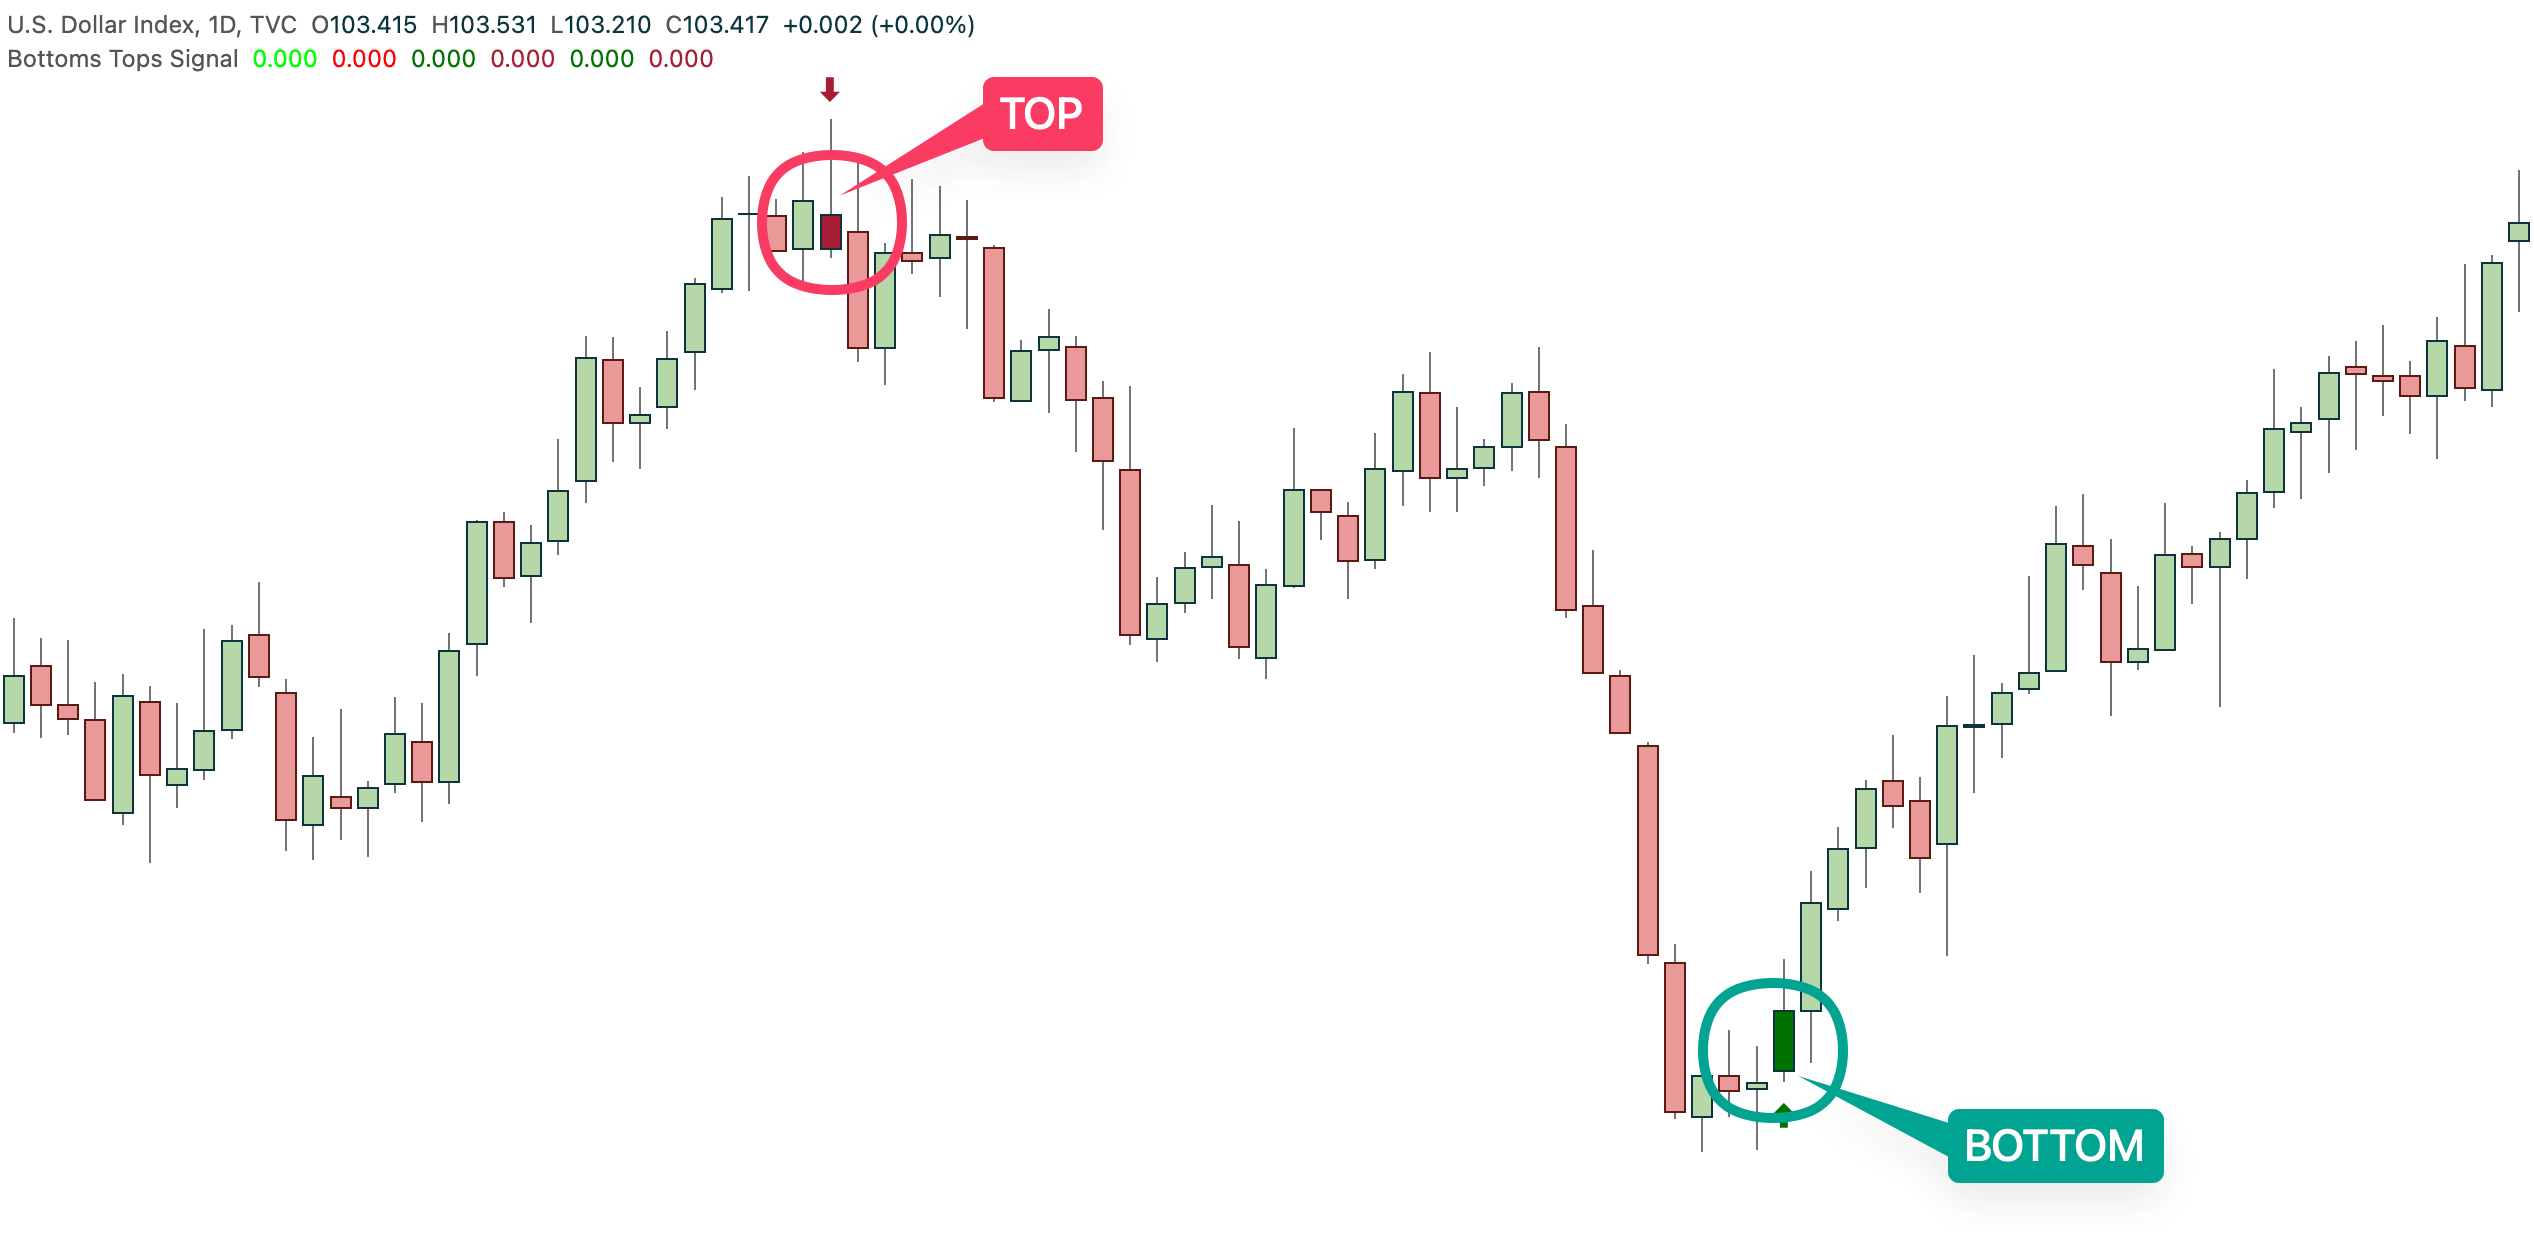
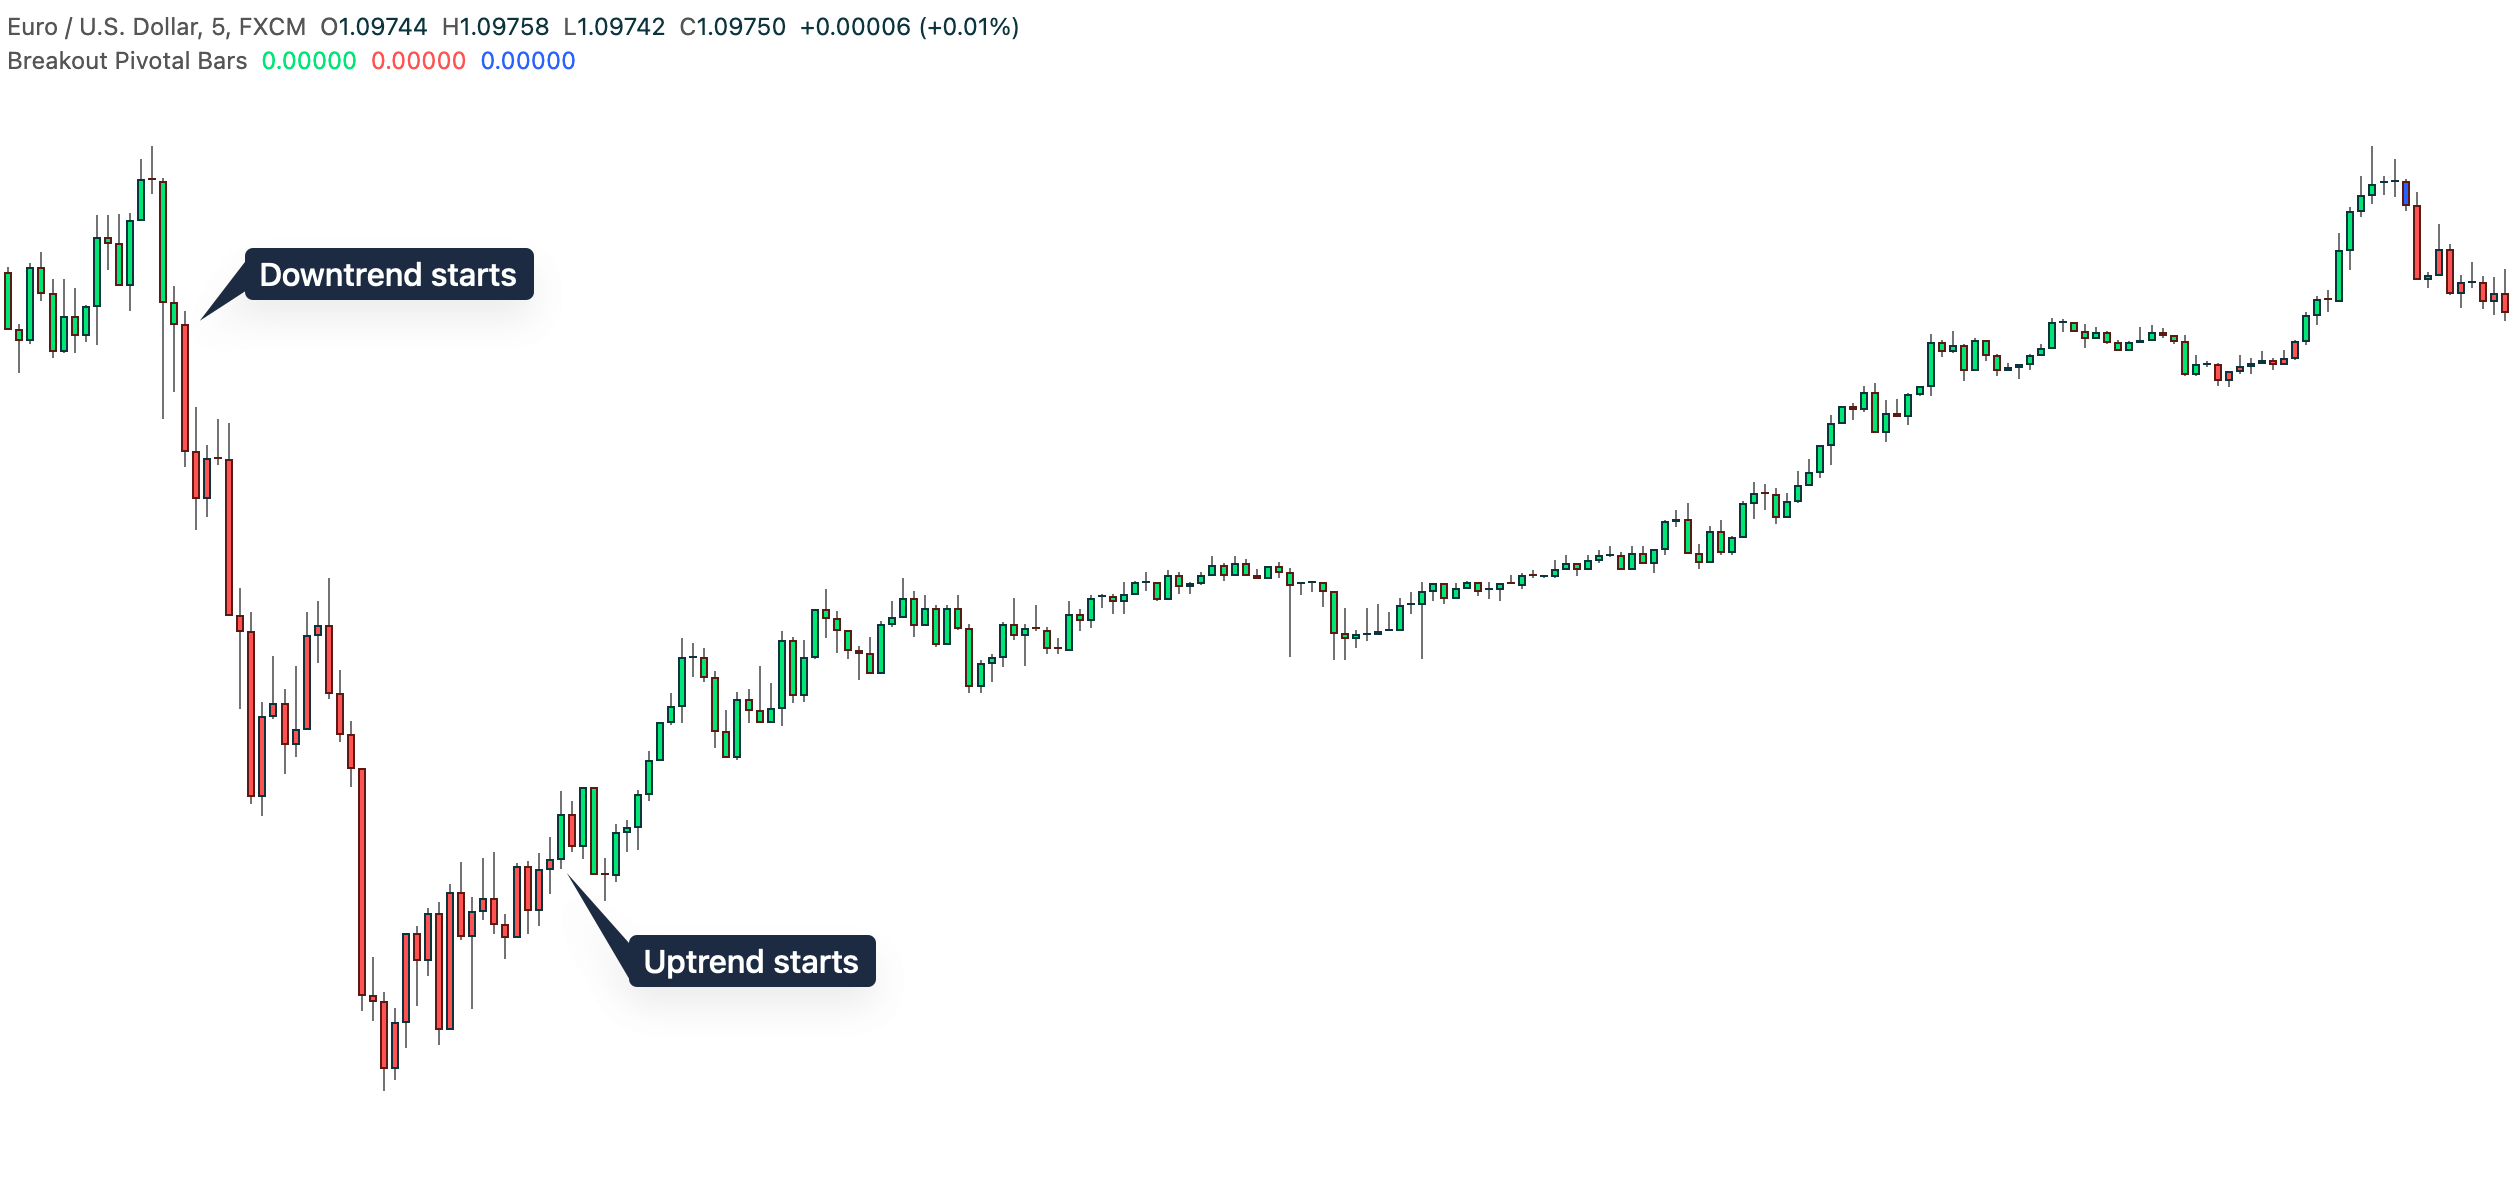
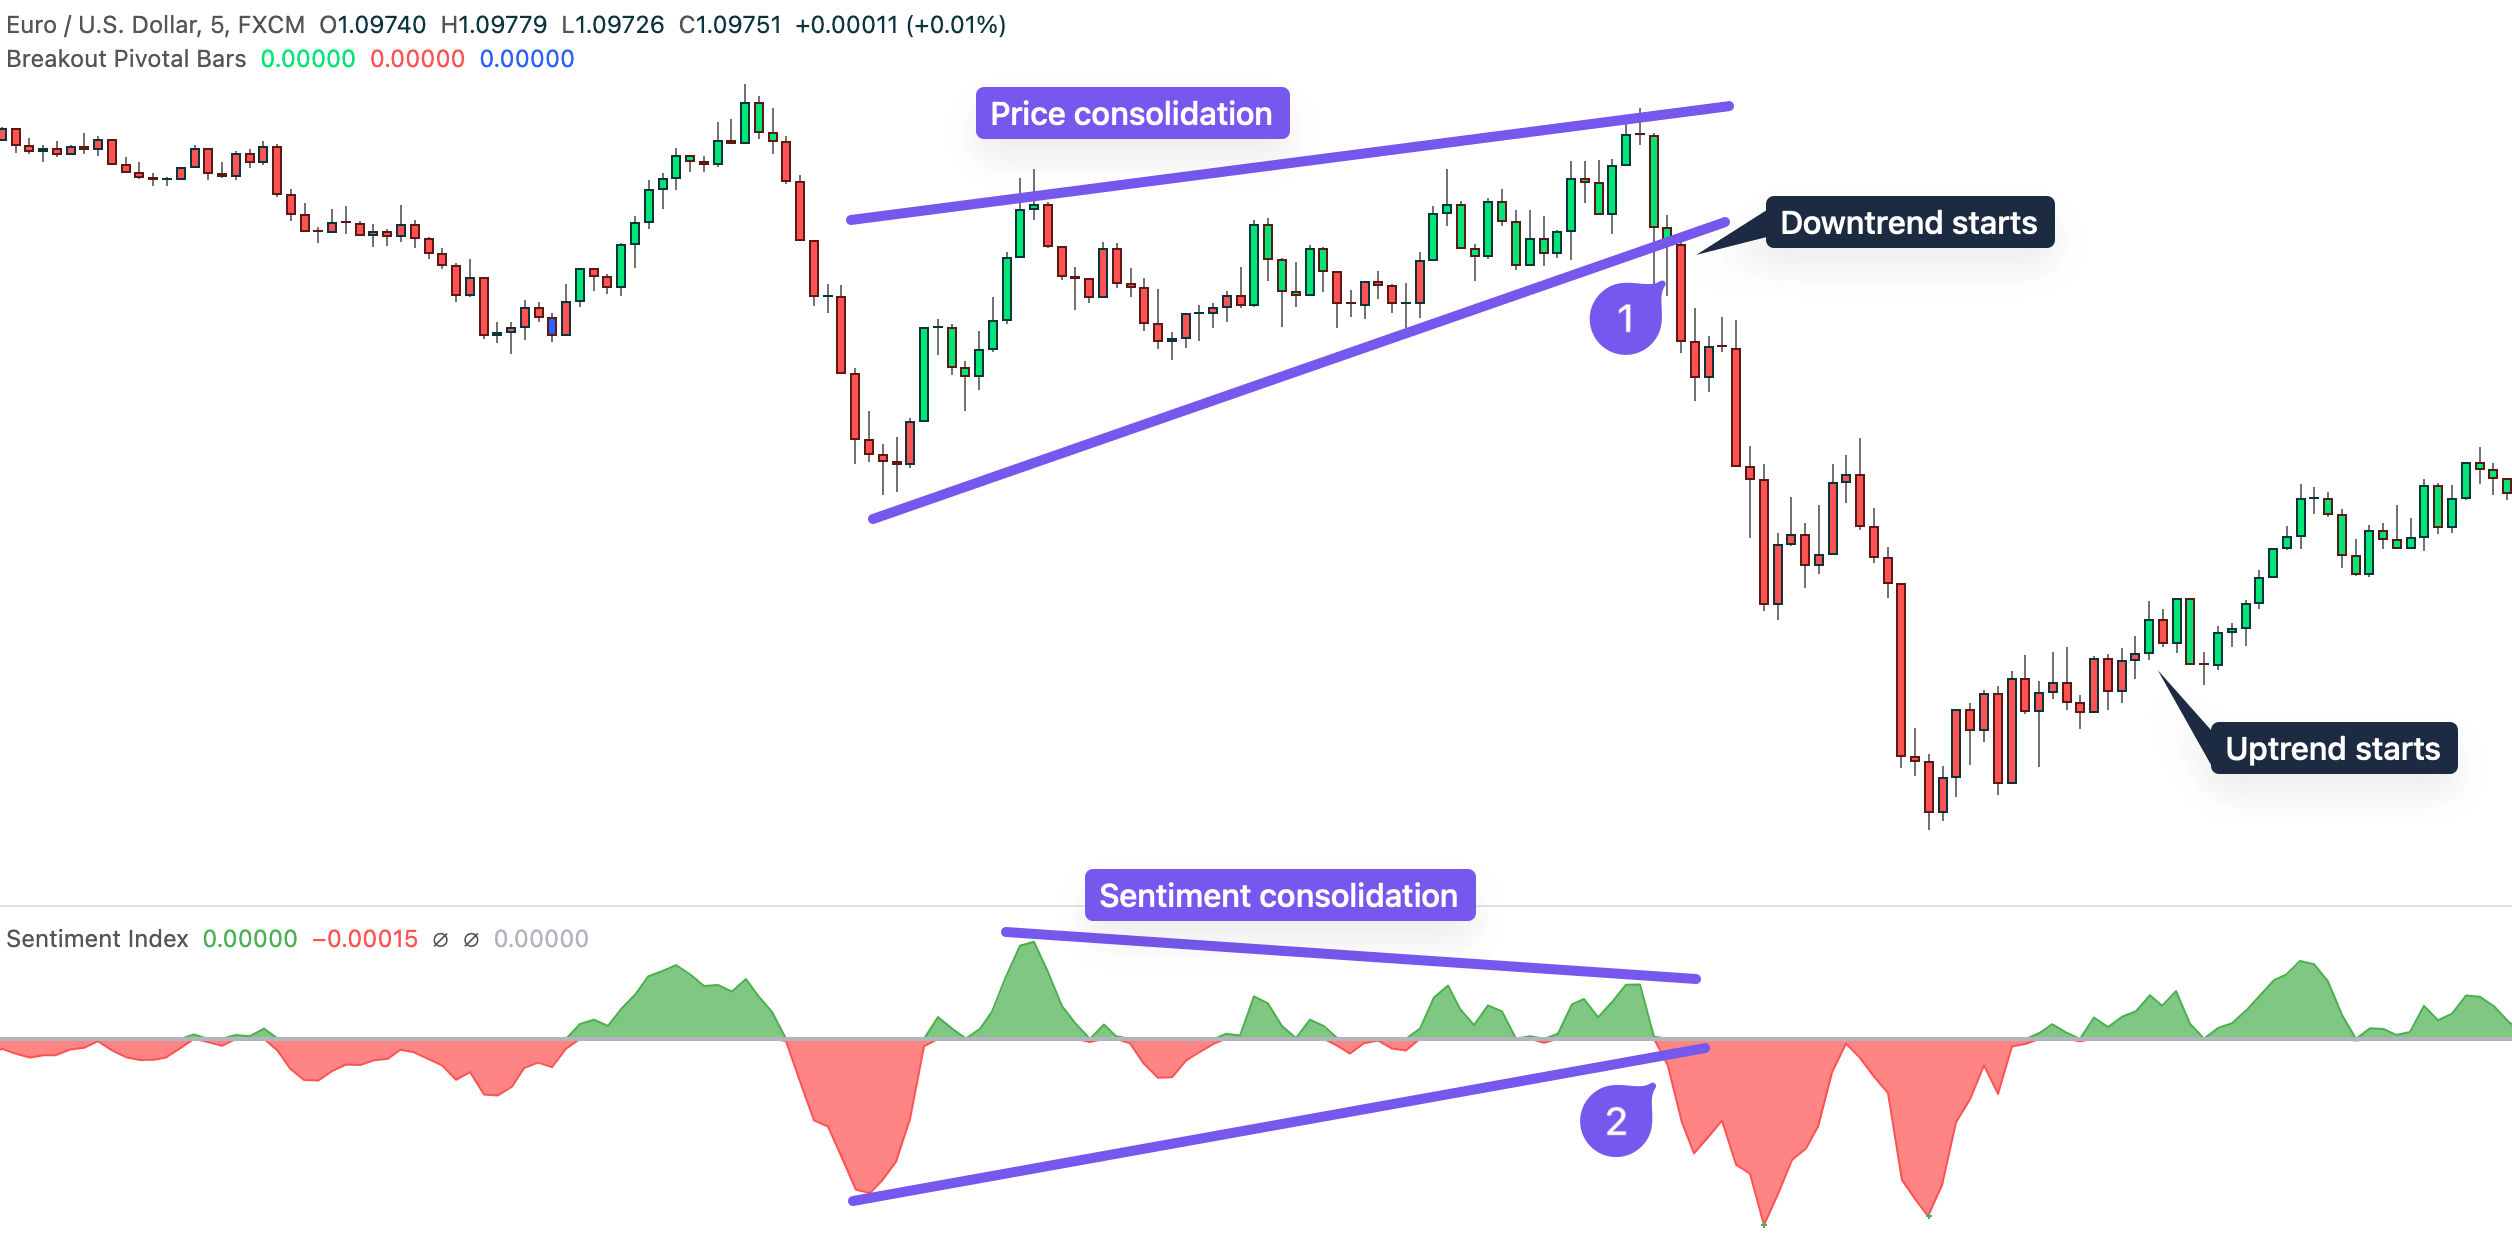
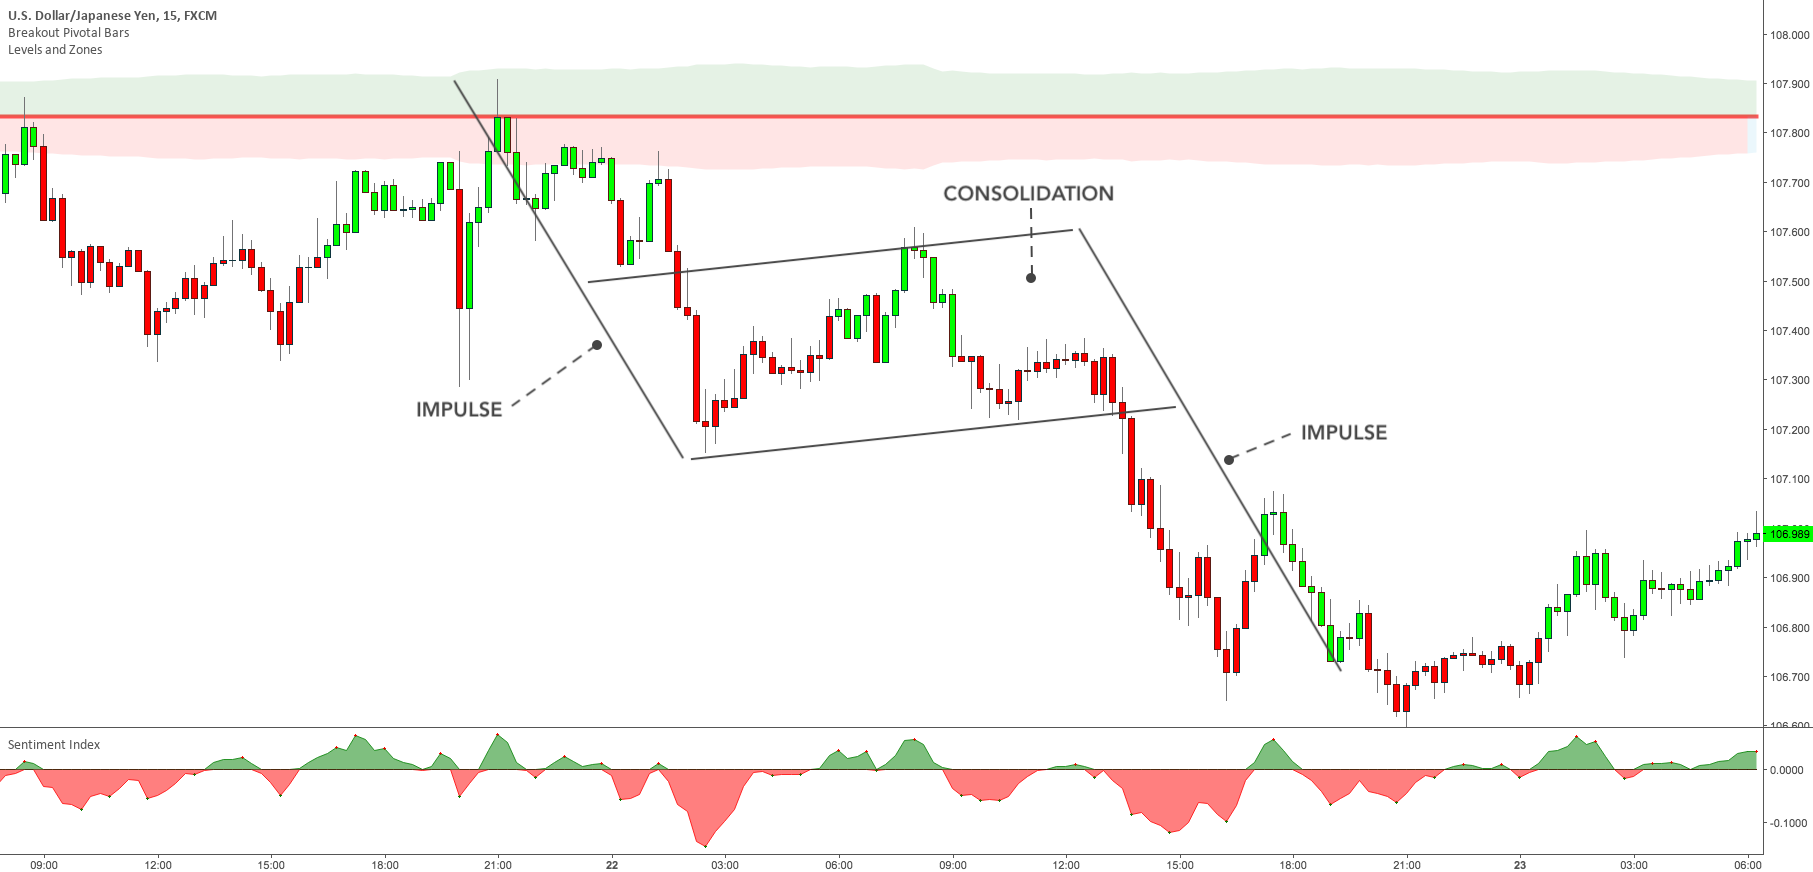
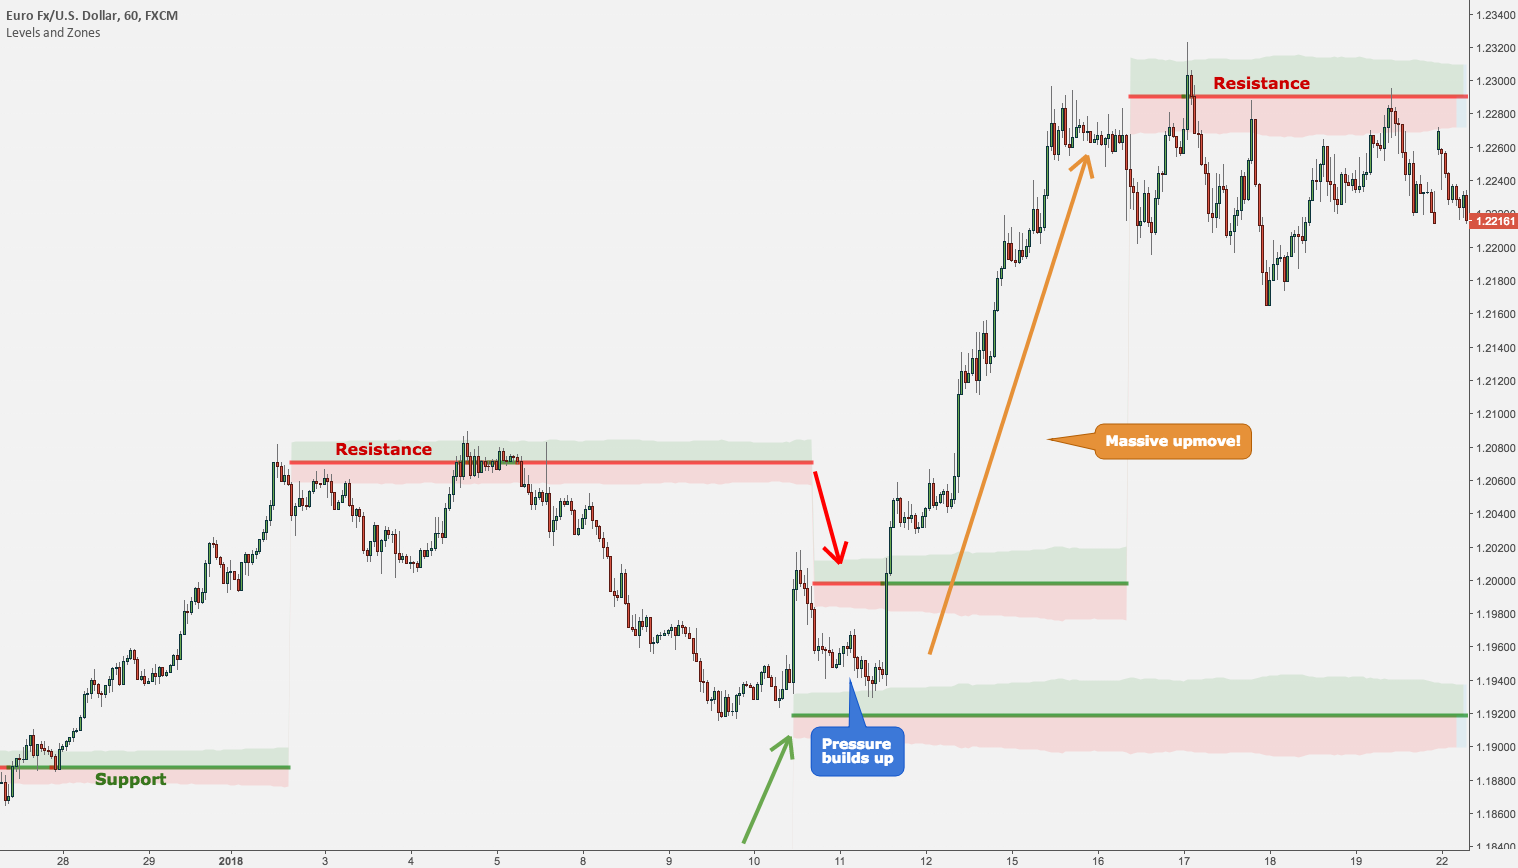
Now, what is the best trend reversal indicator? Look no further than the Breakout Pivotal Bars for TradingView.  Its bars are instrumental in highlighting crucial price action, serving as a beacon for potential trend reversals.

We discussed its potential and flexibility in other articles like this article but, today we’re here to present step-by-step a very profitable setup.

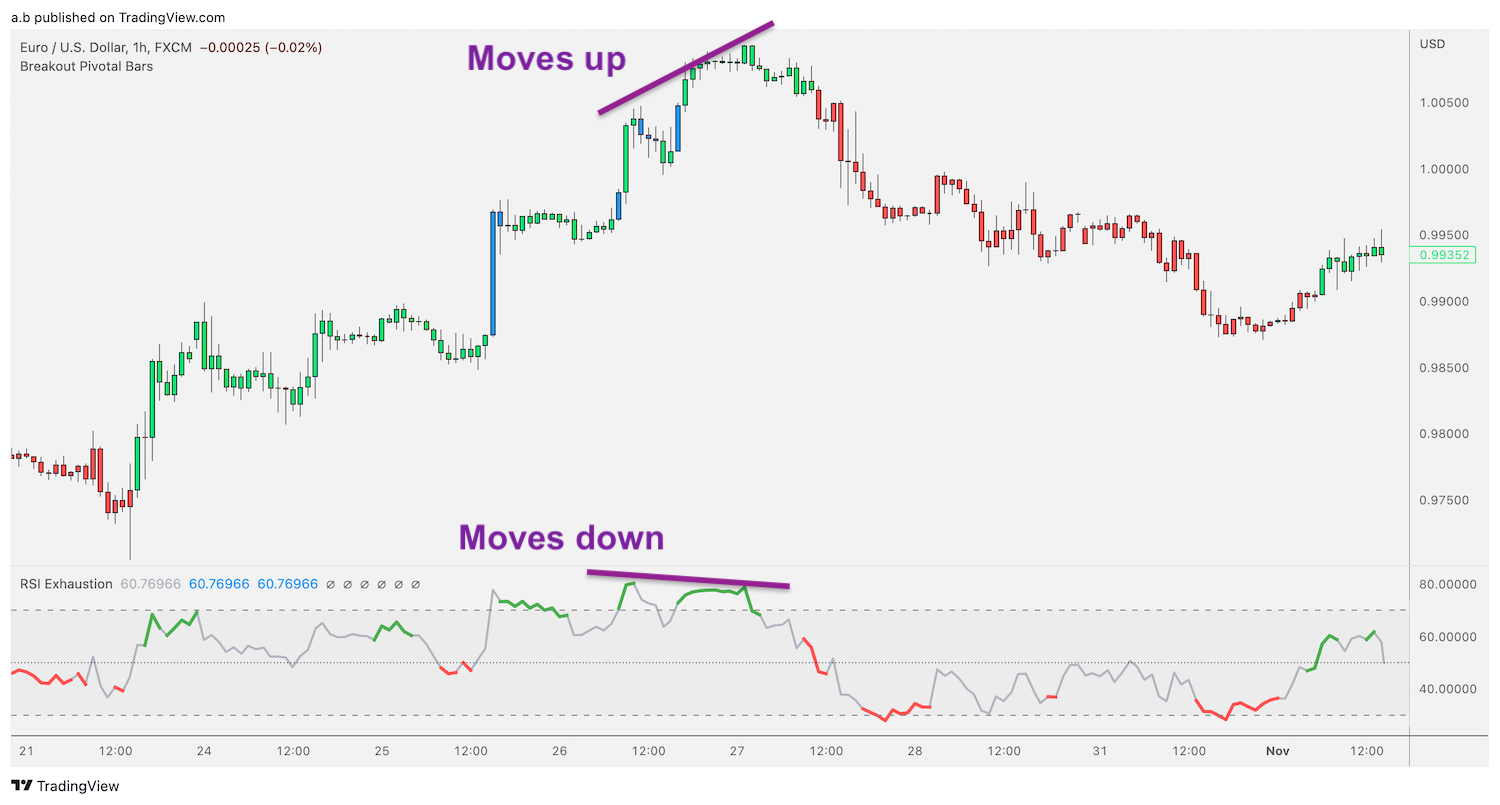
Traders who already use the Breakout Pivotal Bars know that it’s great at identifying and following a trend but, when coupled with other technical indicators, they create a comprehensive toolkit for recognizing market turning points.

Profitable Trend Reversal Setup Explained

To navigate the waters of trend reversal trading successfully, it’s not just about the indicators—it’s about a setup, a profitable setup.

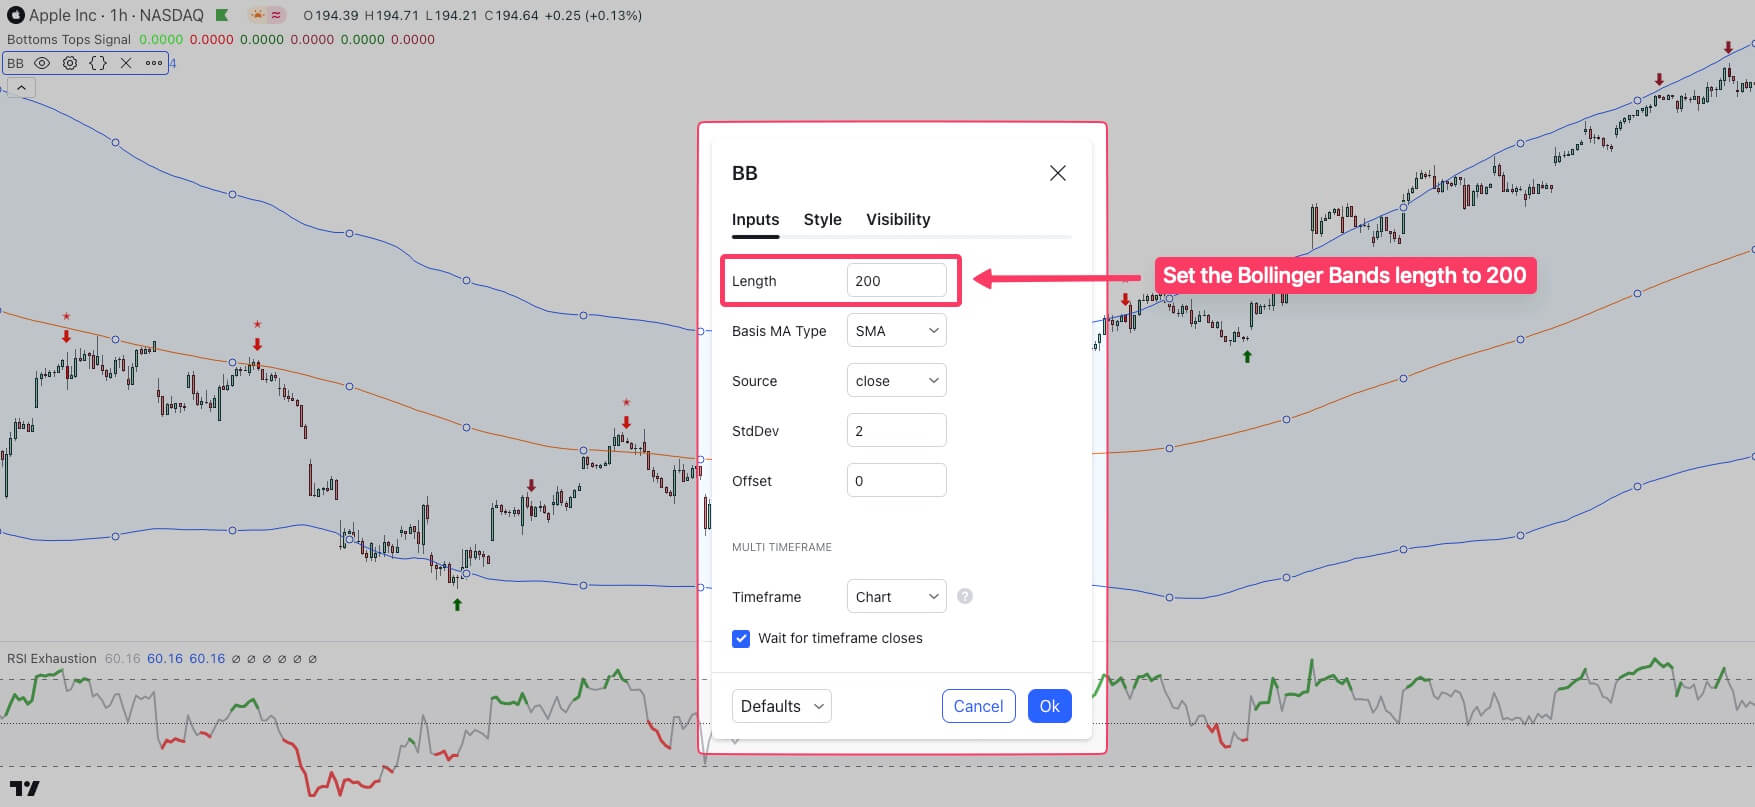
To make it possible, we use the Breakout Pivotal Bars and the RSI Exhaustion which are both included in the 1-Week Free Trial of all Minimalist Trading Indicators – make sure not to miss it, it’s risk-free.

Now to our setup!

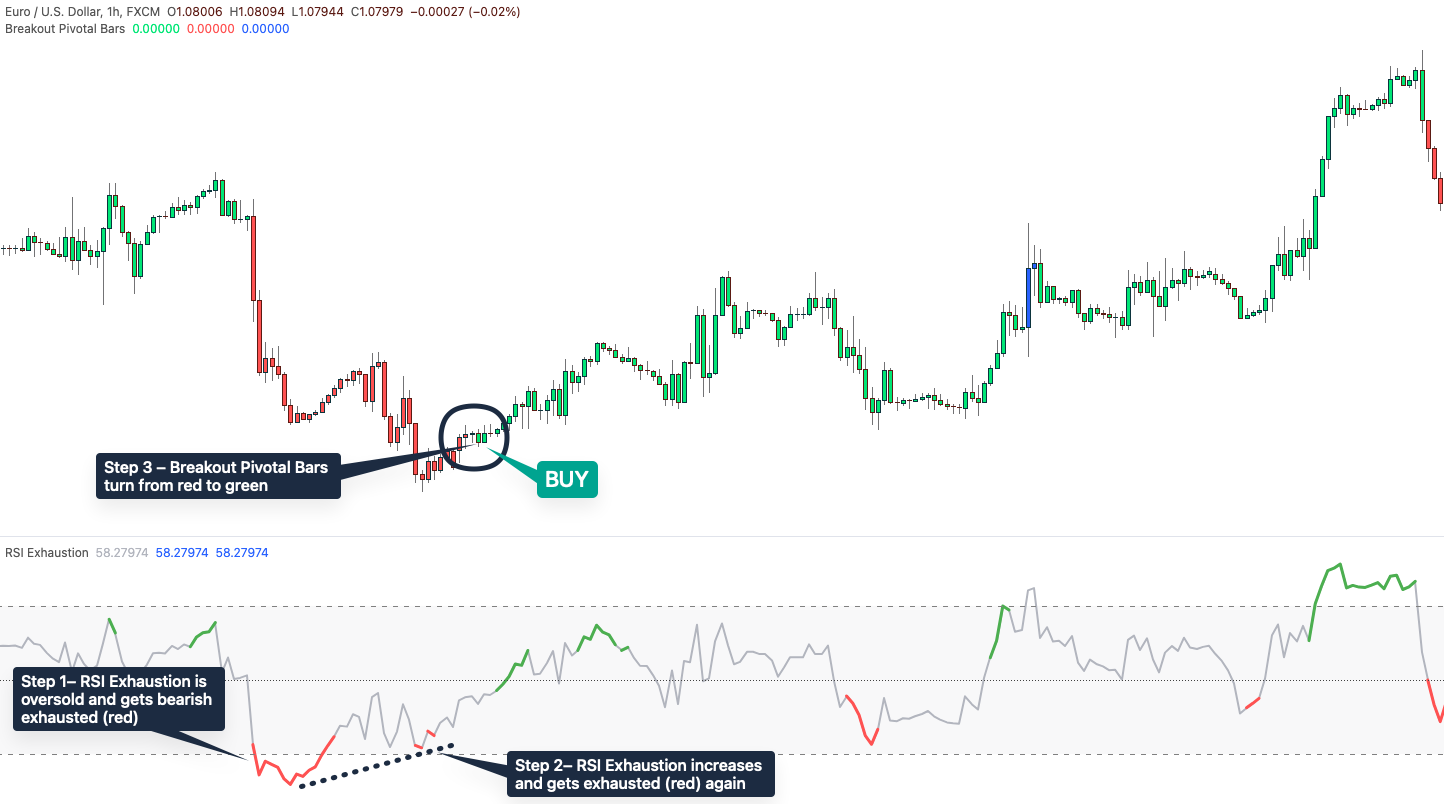
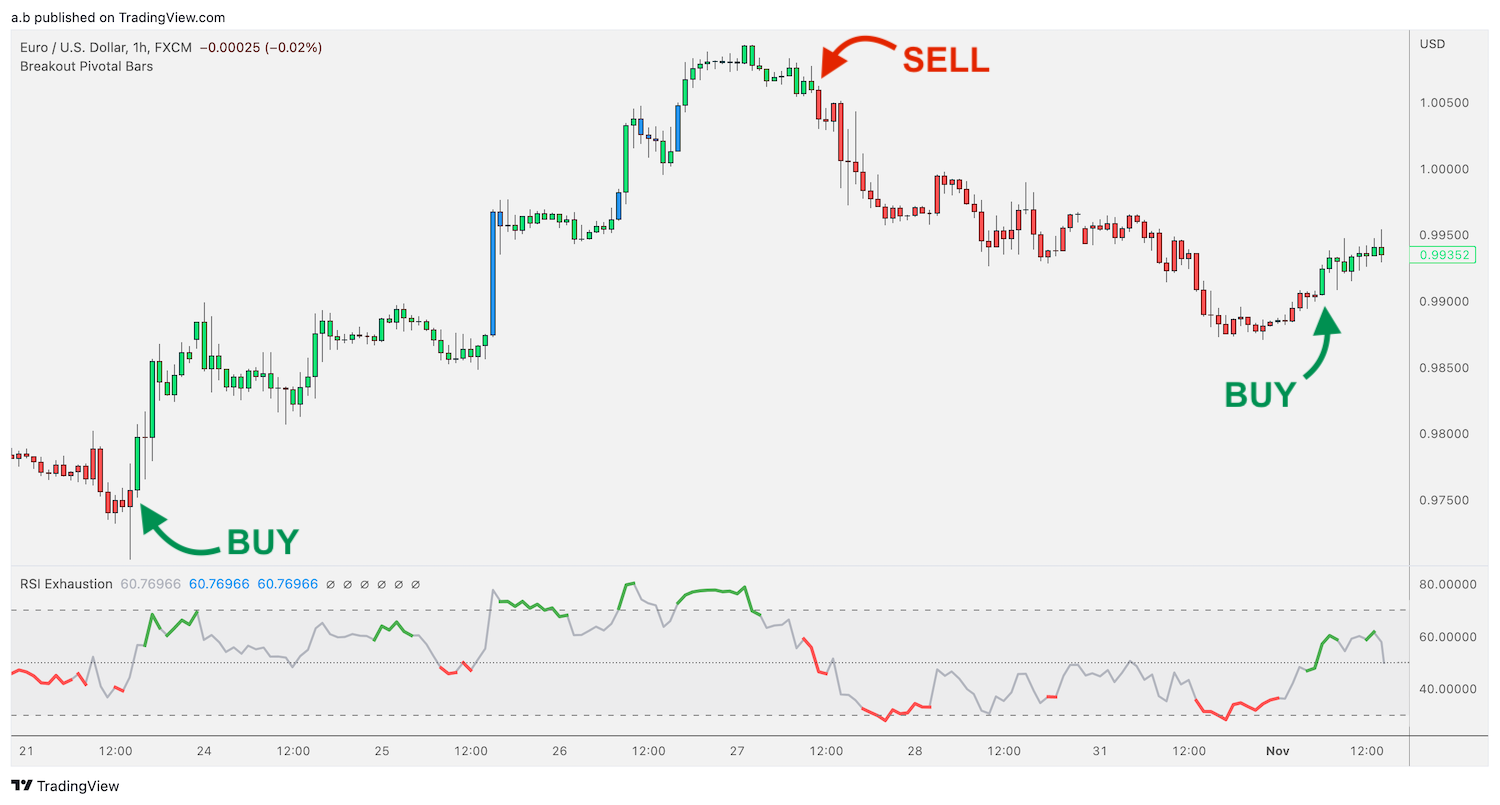
Trend Reversal Trading on TradingView – Buy setup

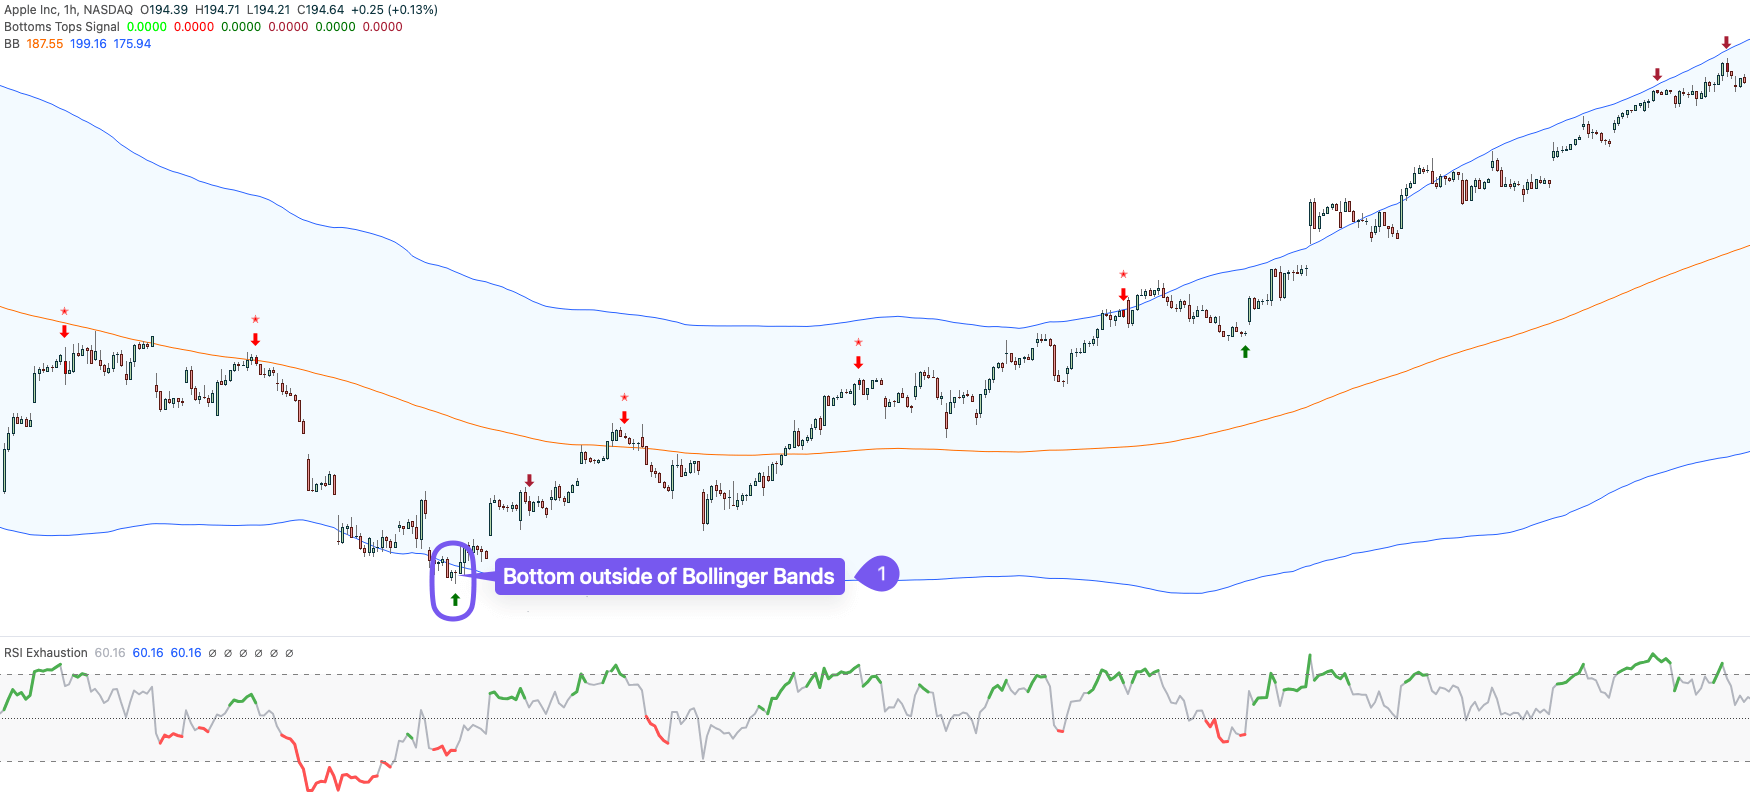
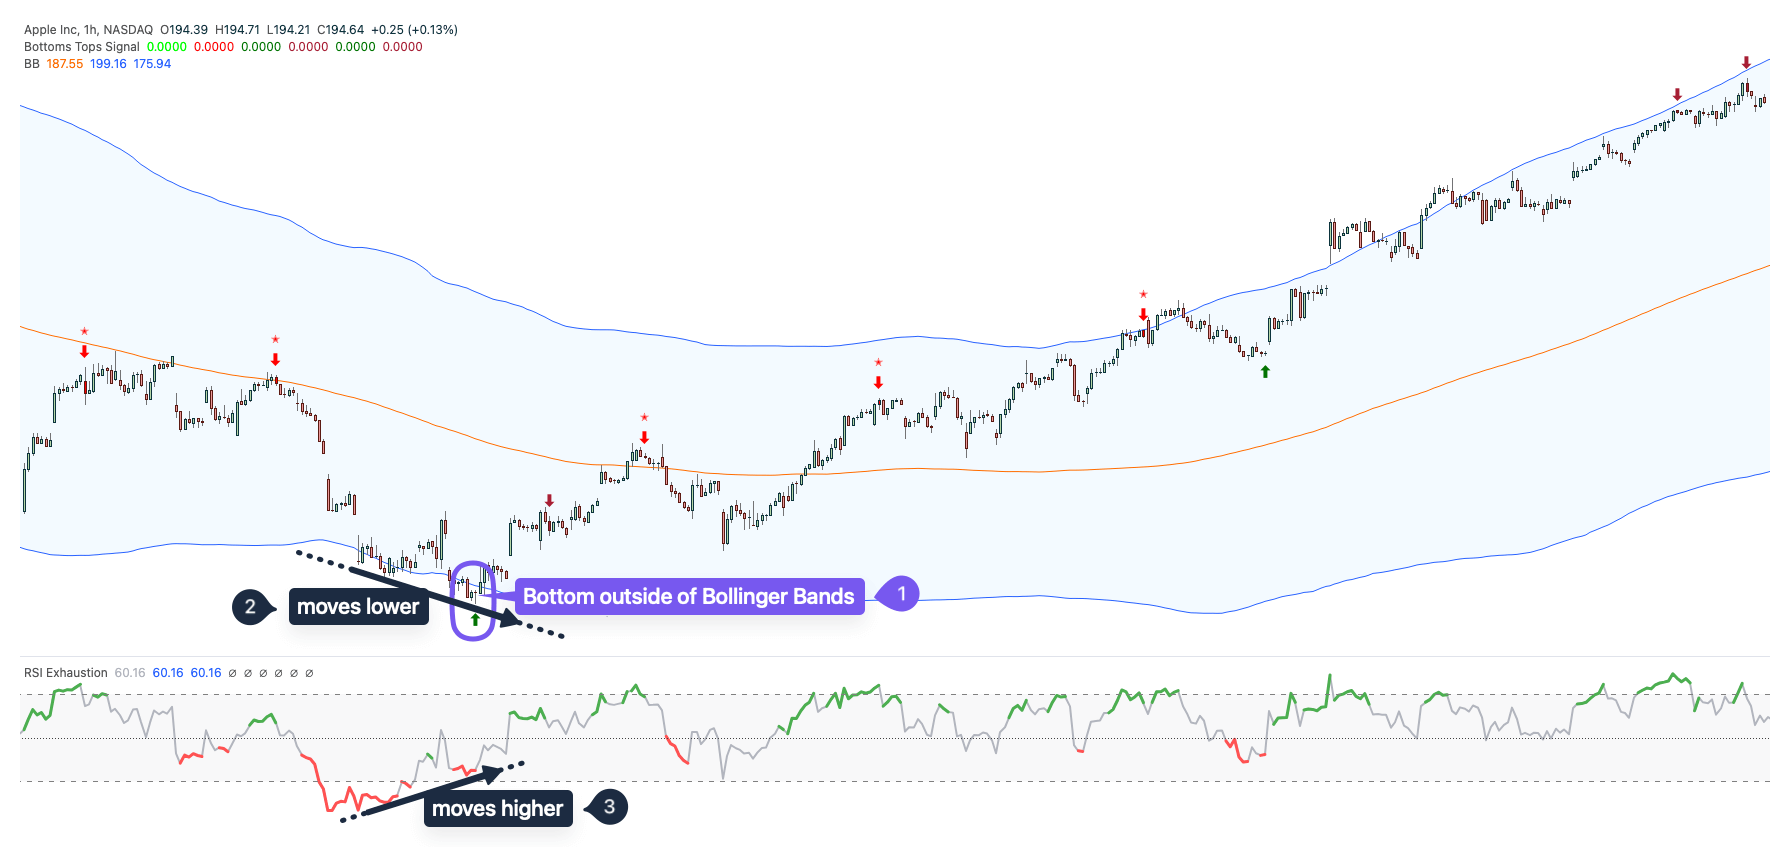
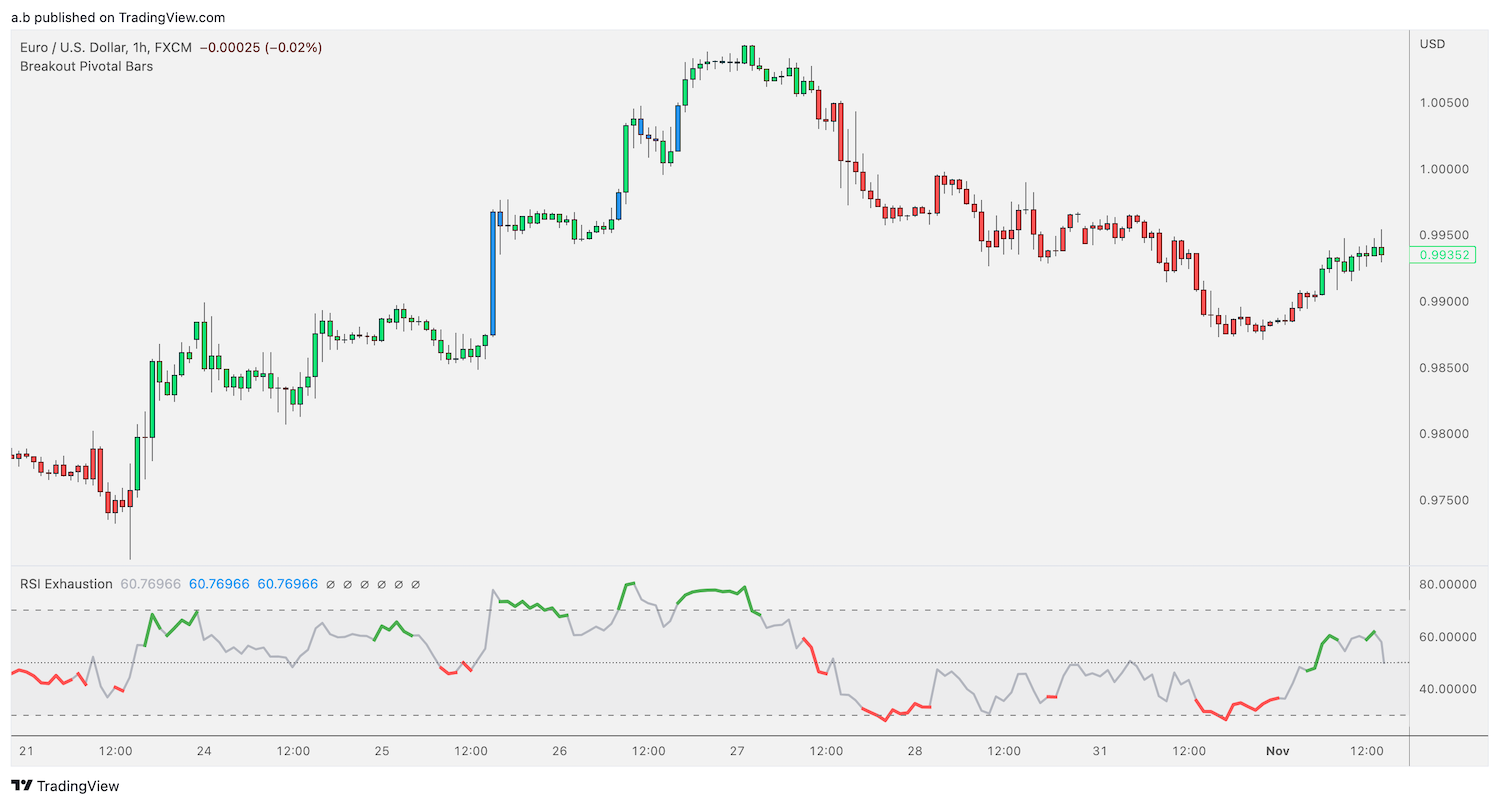
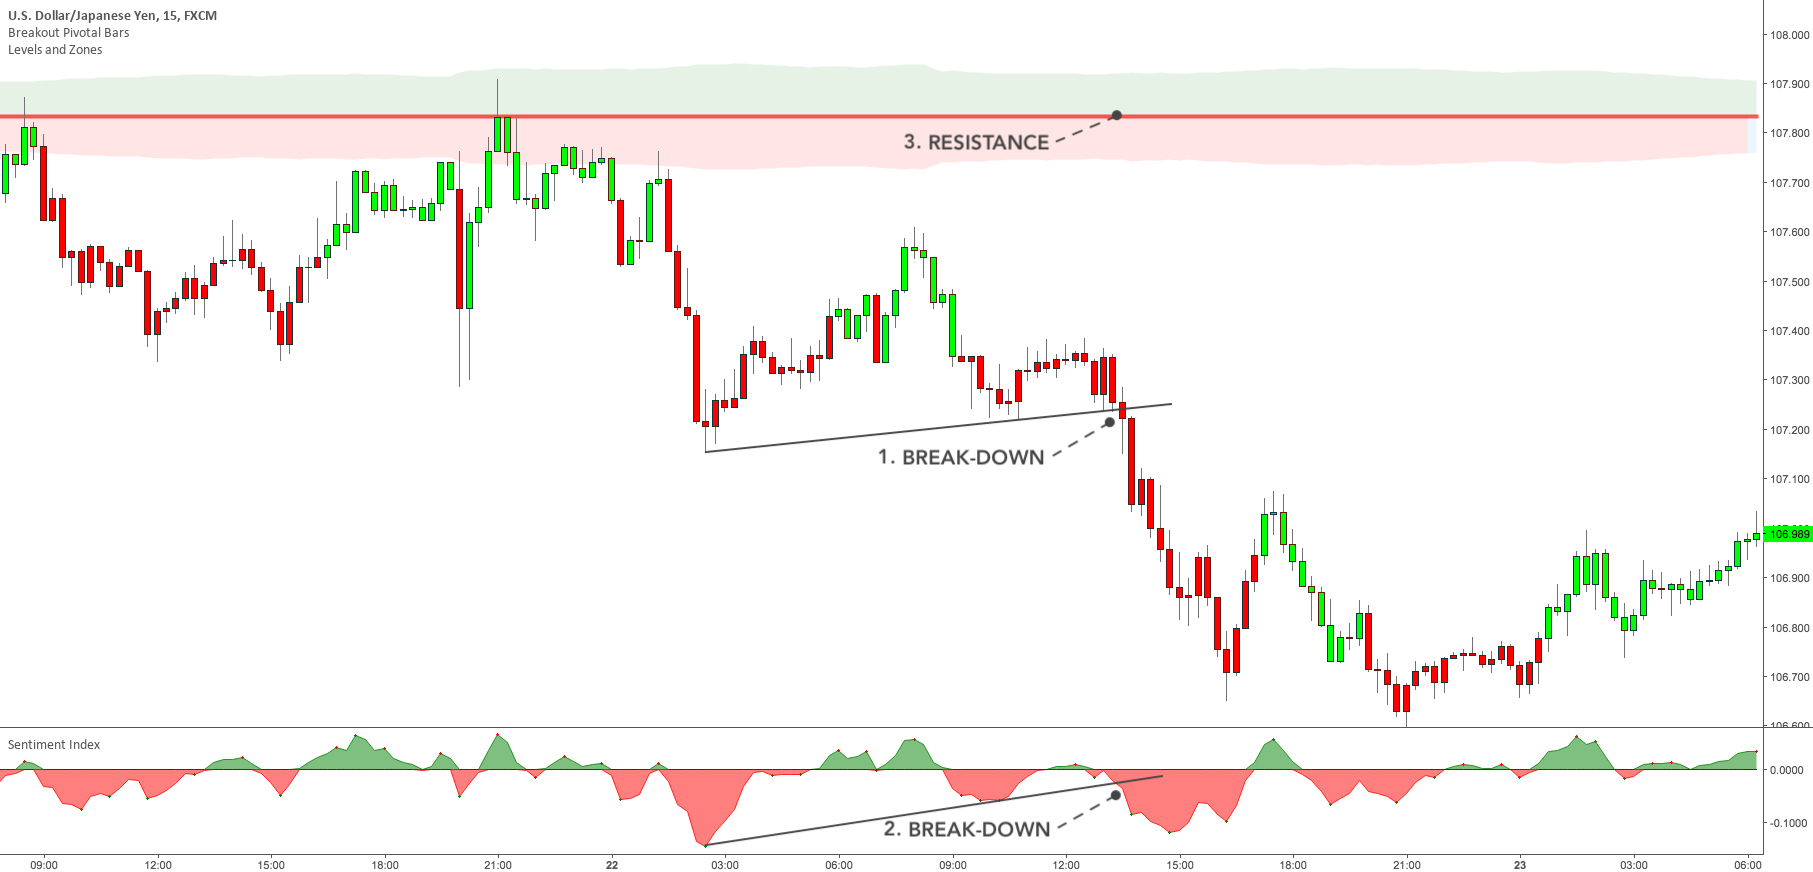
The setup is straightforward to identify and it’s made up of three simple steps.

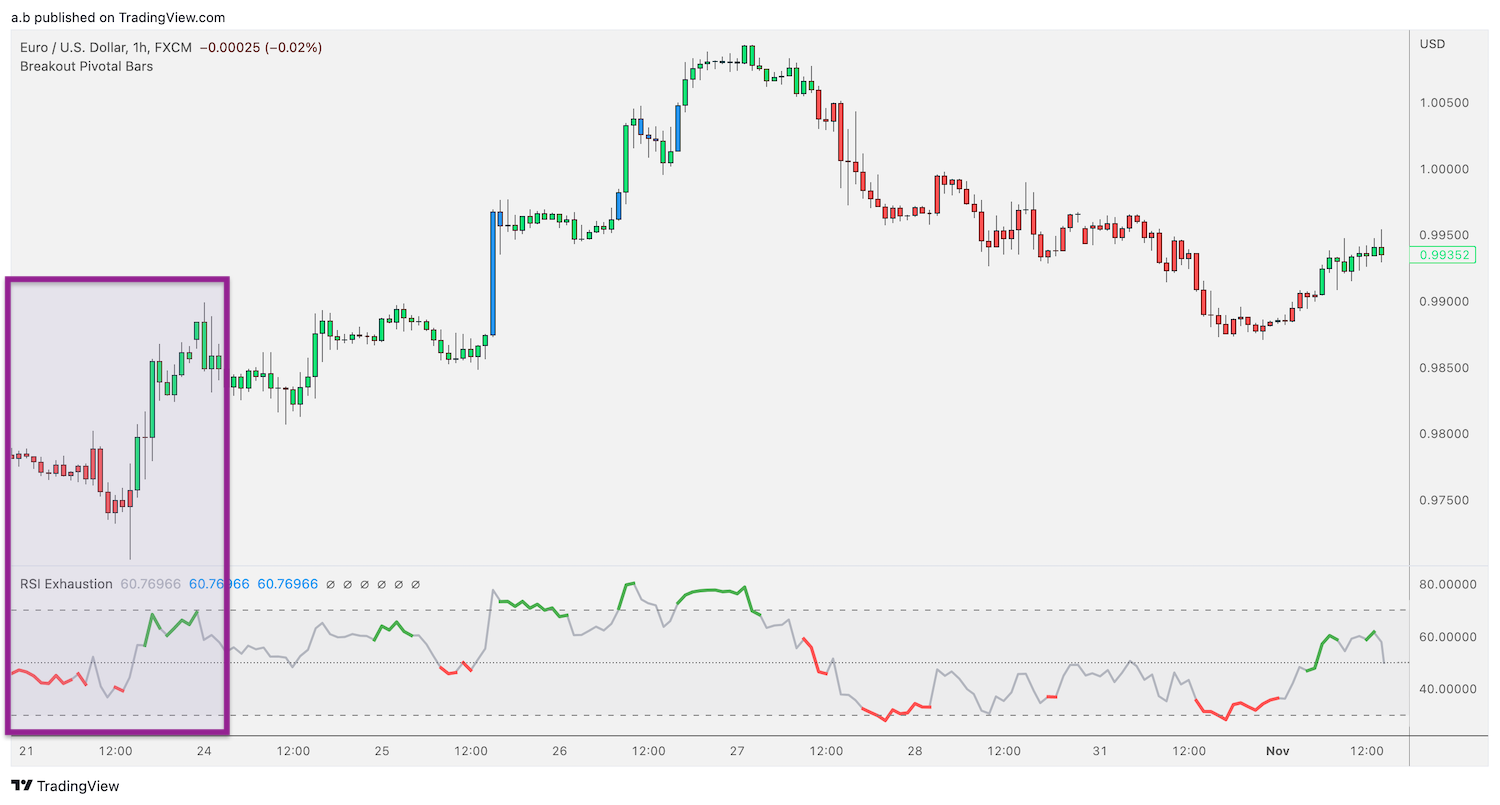
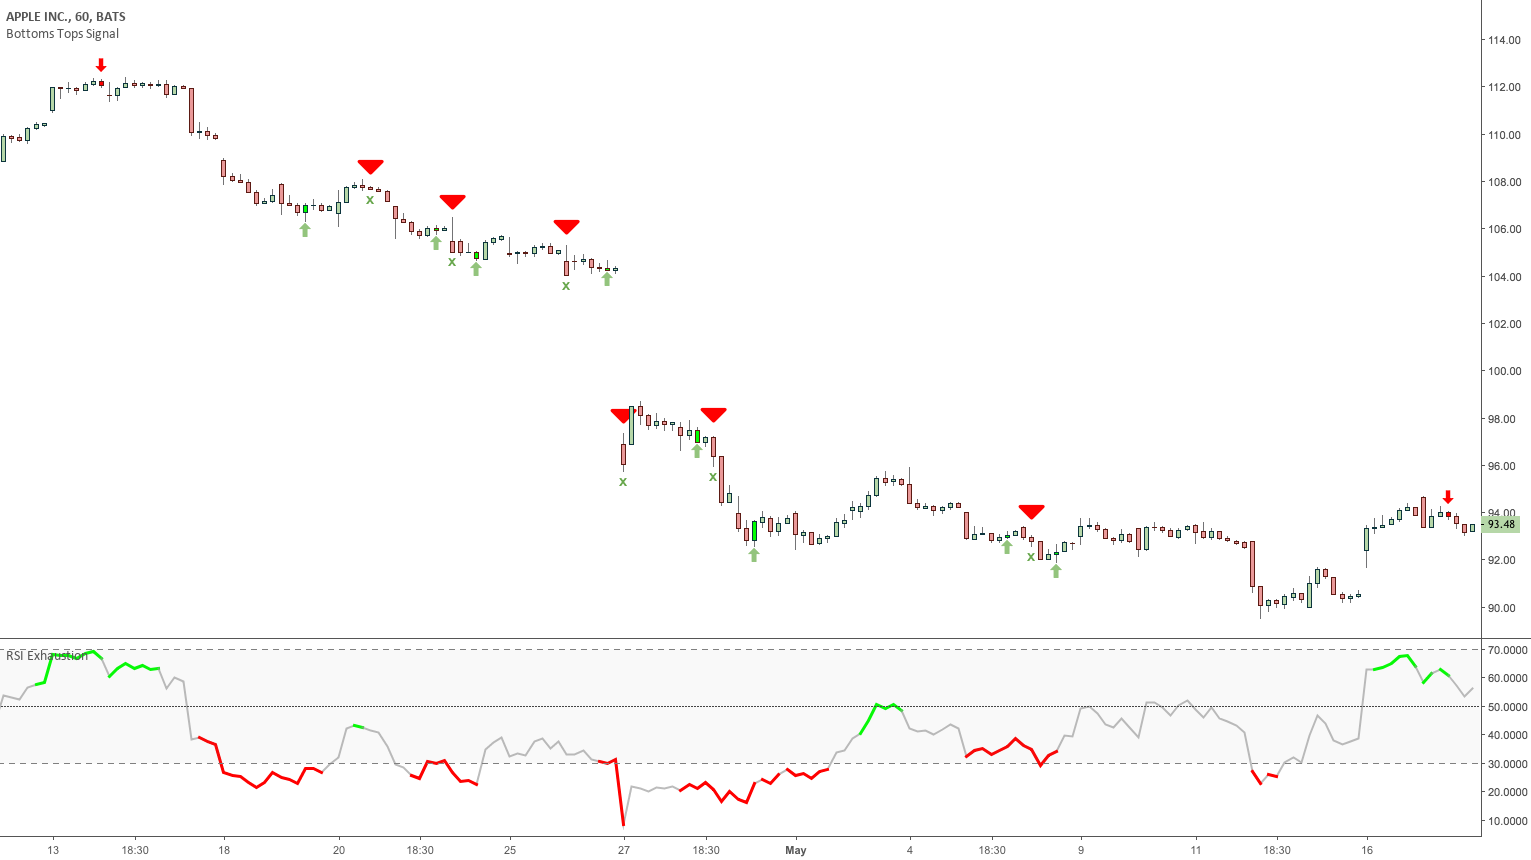
  • Step 1: The RSI Exhaustion at the bottom must go oversold (below the gray area) and become bearish exhausted (colored red).
  • Step 2: The RSI Exhaustion must increase, and turn bearish exhausted a second time.
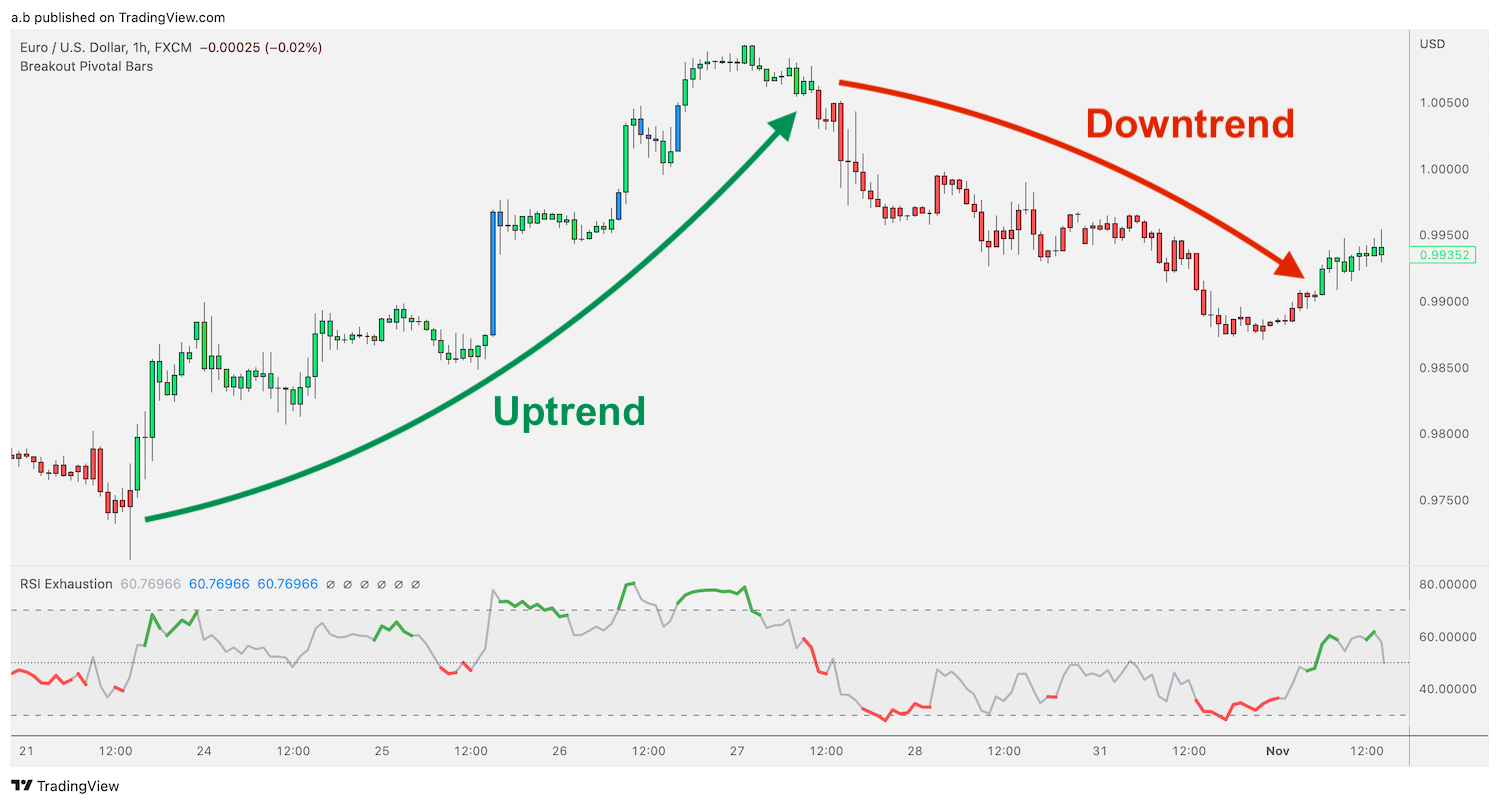
  • Step 3: The Breakout Pivotal Bars must turn from red to green.

There you have it – a clear setup made up of two among the best TradingView indicators for trend reversal trading.

Similarly, you can trade a bearish trend reversal when you get a sell setup.

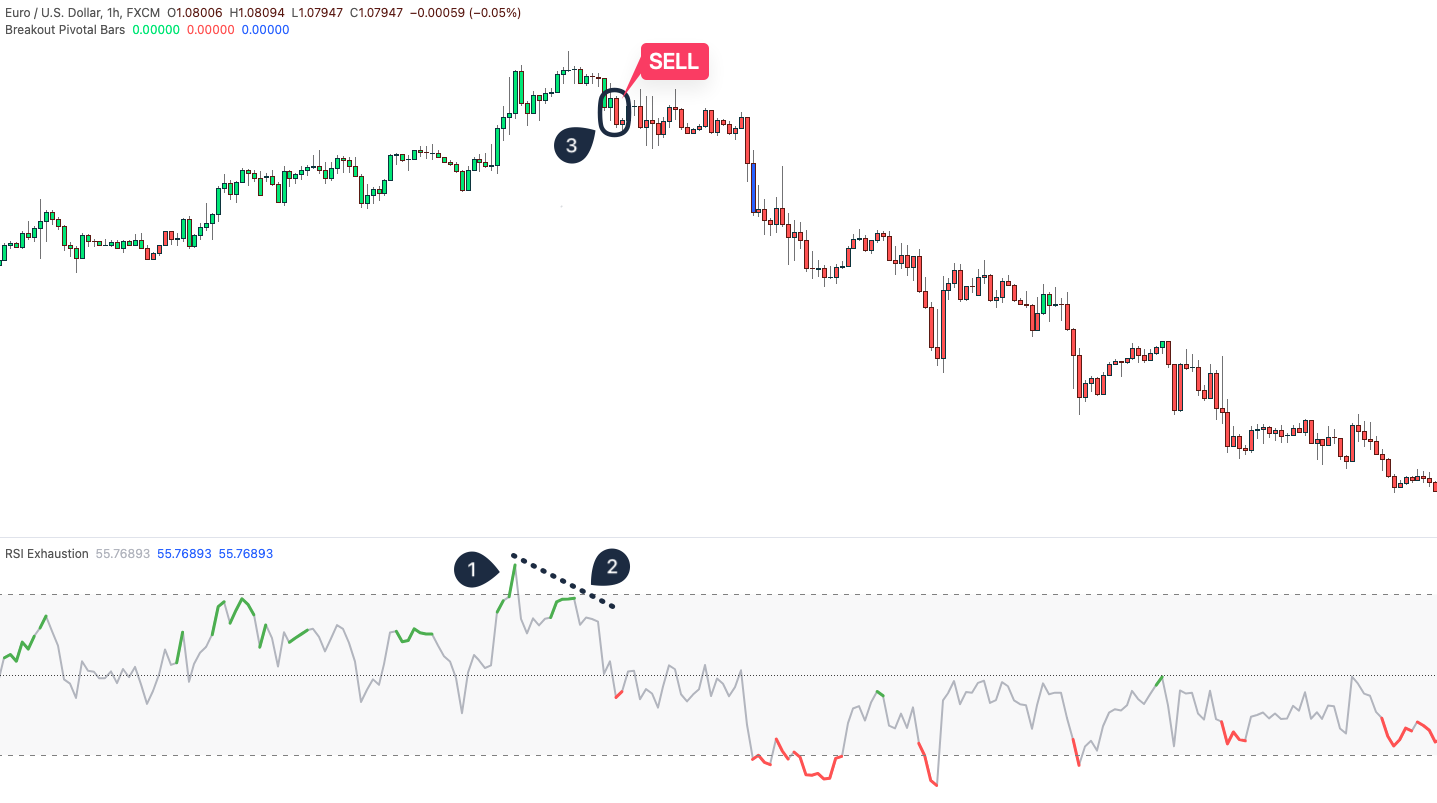
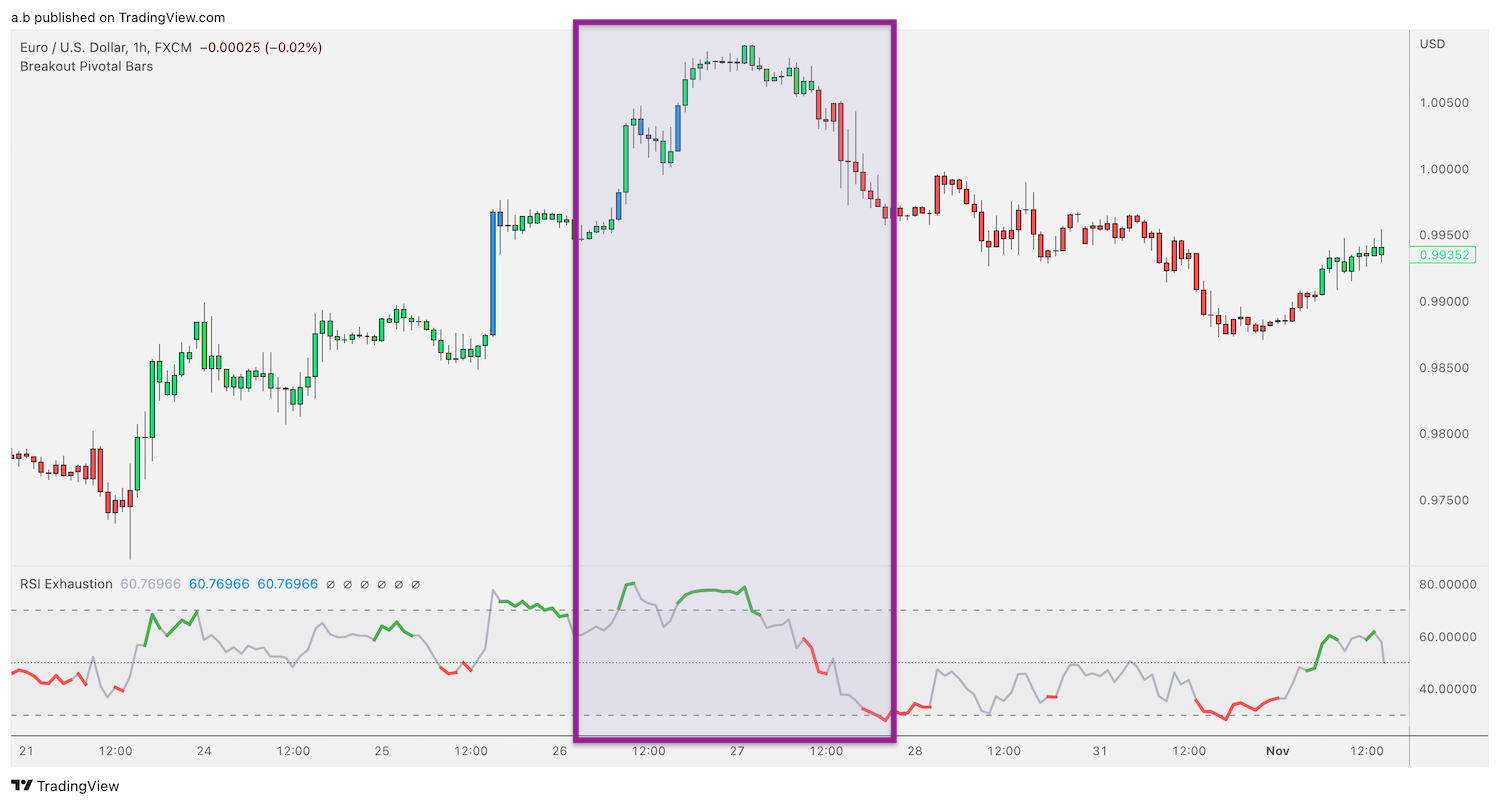
Trend Reversal Trading on TradingView – Sell setup

Here we have an identical setup with the same steps (1, 2, and 3) but simply flipped.

The Importance of Using the right Trading Tools

Here’s the deal: having the right tools at your disposal can significantly impact your trading success. Platforms like TradingView provide a plethora of tools and indicators to aid in trend trading.

Additionally, integrating Minimalist Trading Indicators, popular for their accuracy and reliability, can be a game-changer, and best of all, you can Try the Indicators for Free.

The Bottom Line

In conclusion, trend reversal trading holds immense potential, provided you approach it with the right tools and setups. It’s as simple as following market movements, and capitalizing on opportunities when they arise.

Free TradingView Indicator + 2 Minimalist Tools

Free TradingView Indicator + 2 Minimalist Tools 1500 1000 Minimalist Trading - Indicators for TradingView

Free TradingView Indicator + 2 Minimalist Tools

Are you ready to supercharge your trading strategy?

Buckle up because today, we’re about to unveil an absolute game-changer that might just become your ultimate trading arsenal.

Picture this: combining the power of a Free TradingView Indicator with two incredibly powerful Minimalist tools.

Yes, you heard that right – this trio has the potential to revolutionize your trading game, and here’s the inside scoop on why it’s a game-changer.

What Makes This Setup Unique?

Let’s cut to the chase – what sets this trio apart from the rest?

Imagine having the ability to merge the power of Bollinger Bands in identifying extreme volatility with the crystal-clear signals generated by the Bottoms Tops Signal and RSI Exhaustion.

The result? A combination that amplifies your ability to seize lucrative trading opportunities while minimizing risks.

When Should I Use This Setup?

We already discussed the incredible power of the Bottoms Tops Signal and RSI Exhaustion in our popular article about Contrarian Investing.

Today, we’ll expand on that to explain an even better setup!

Now, you might be wondering, “When’s the perfect moment to deploy this powerhouse trio?”

The answer is as simple as the setup: when a specific event occurs.

What event?

The Bottoms Tops Signal and RSI Exhaustion independently provide solid indications of potential market shifts. However, when intertwined with the Bollinger Bands, their combined impact becomes even more pronounced.

In fact, the Bollinger Bands help gauge volatility, the Bottoms Tops Signal pinpoints potential trend reversals, while RSI Exhaustion identifies overbought or oversold conditions.

Ready? Let’s build the setup!

How To Build the Setup?

The prerequisites are very simple:

  • Step 1: Add the Bottom Tops Signal and the RSI Exhaustion to your chart
  • Step 2: Add the Bollinger Bands (free indicator on TradingView) and change
  • Step 3: Set the Bollinger Bands length to 200

Set the Bollinger Bands length to 200 in the indicator’s Settings.

Now that the Bollinger Bands and the two Minimalist Trading Indicators are added to the chart, we can build the setup.

The first condition is that there’s a Bottom outside of the Bollinger Bands.

There’s a Bottom outside of the Bollinger Bands.

It’s seems like an already great setup but that’s not enough to guarantee it’s a high-probability setup.

In order to do that, we need to have at least two more conditions: the Price moves lower while the RSI Exhaustion moves higher.

The Price moves lower while the RSI Exhaustion moves higher.

So, let’s summarize the setup:

  • Condition 1: There’s a Bottom outside of the Bollinger Bands.
  • Condition 2: The Price moves lower.
  • Condition 3: The RSI Exhaustion moves higher.
  • Bonus Tip: The setup has an even higher probability if the RSI Exhaustion is exhausted (in the example above, the RSI line gets colored red when the Bottom forms).

As you can see, that single bottom was a tremendous trading opportunity. Of course, the same setup structure applies to Tops with opposite conditions.

Can I Trade this Setup Consistently?

Absolutely! This setup repeats itself over and over across different asset classes and timeframes.

Make sure to experience firsthand how this trio can elevate your trading by grabbing a 1-Week Free Trial of all Minimalist Trading Indicators.

It’s risk-free and has the potential to change your trading forever.

Is this Setup For Me?

Let’s be honest – not every setup works for every trader.

If you are looking for high-probability setups, with low-risk and big potential returns, this setup is definitely for you.

In fact, given the conditions discussed above, it is extremely likely that a major move will happen next – in our example, it was a major uptrend.

If instead, you want quick entries and exists, lower returns and you are a risk-taker, then this setup might not be the best for you.

The choice is yours but its simplicity and high-probability are worth a try.

Our Minimalist Trading strategies often triumph in their straightforwardness, and this setup is no exception.

By integrating these indicators seamlessly on TradingView, you gain access to a tremendous opportunity to elevate your trading forever.

In fact, the combination of the Bollinger Bands – available for free on TradingView – with the Bottoms Tops Signal and the RSI Exhaustion forms a robust trifecta.

Ready to take your trading to the next level?

Contrarian Investing - Minimalist Trading - TradingView

Contrarian Investing: Dare to be Different

Contrarian Investing: Dare to be Different 1500 1000 Minimalist Trading - Indicators for TradingView

Contrarian Investing: Dare to be Different

Ever heard about contrarian investing?

It’s not just a trendy phrase. In fact, it’s a whole different approach to investing and trading.

And let’s be honest.

It’s not for the faint-hearted! But hey, who said making profits in the market was easy?

The Advantages of Contrarian Investing

What’s the deal with contrarian investing?

Picture this: while the majority of investors are flocking to buy a certain asset because it’s soaring high, contrarian investors dare to swim against the tide.

They’re the ones diving into assets that are being overbought or oversold by the general Market Sentiment.

Now, you might be wondering, “But why would anyone want to do that?”

The bottom line?

It’s about seeing the bigger picture. Contrarian investors believe that the Market Sentiment can be indicative of incredible opportunities for those willing to think differently.

Underlying Approach and Strategy in Contrarian Investing

Contrarian investing isn’t about blindly going against the flow.

It’s a strategic approach rooted in analysis and understanding market psychology.

Remember, it’s not about being a contrarian just for the sake of it; it’s about calculated moves based on solid analysis.

Let’s talk about the advantages.

When you go against the herd, there’s potential for substantial gains.

How?

Well, when everyone is hyped about an asset, its price might be inflated, creating a risky overbought situation.

Meanwhile, a seemingly “unpopular” asset might hold immense potential overlooked by others.

That’s where the contrarian approach shines. By picking oversold or overbought assets, there’s potential for significant profits when the market eventually corrects its perception.

Tools for Contrarian Investors

I can’t emphasize this enough: timing is key!

Identifying market bottoms or tops through indicators like the Bottoms Tops Signal indicator for TradingView can be instrumental.

It helps to recognize potential turning points in an asset’s price trend.

A Top and a Bottom with the Bottoms Tops Signal indicator on a DXY TradingView chart

A Top and a Bottom with the Bottoms Tops Signal indicator on a DXY TradingView chart

See for example the chart above.

Both a major top and a major bottom were signaled in real-time by the Bottoms Tops Signal on DXY – congrats to those traders who traded both!

But it could be even better!

In fact, combining multiple indicators can make setups less risky and incredibly more consistent.

See the following chart.

Bottoms Tops Signal and RSI Exhaustion indicators on EUR USD TradingView chart

Bottoms Tops Signal and RSI Exhaustion indicators on EUR USD TradingView chart

Not only the Bottoms Tops Signal shows multiple bottoms and tops but also, when combined with the RSI Exhaustion indicator for TradingView, it shows a high-probability opportunity that smart traders won’t miss.

Let’s analyze the opportunity.

The price moves higher, making quick movements. At the same time, the RSI Exhaustion at the bottom of the chart moves lower.

But that’s not all.

In fact, the RSI Exhaustion becomes repeatedly overbought (above the gray area) and it gets exhausted multiple times (colored in green instead of gray).

When you combine all this to the top above you get a high-probability contrarian opportunity.

By using two simple yet long-validated tools we were able to profit from a high-probability opportunity that others will consistently miss.

With the right tools, adopting a contrarian approach leads to unconventional profits in high-probability opportunities.

In Conclusion

In conclusion, contrary to popular belief, daring to be different, taking calculated risks, and having the confidence to stand out from the crowd can indeed lead to unconventional profits.

Remember, in the ever-evolving markets, being a nonconformist might just be the edge you need for investment success.

Stay curious and keep exploring those contrarian strategies!

Trend Indicator for TradingView

Stop Guessing, Start Winning: The Best Trend Indicator on TradingView!

Stop Guessing, Start Winning: The Best Trend Indicator on TradingView! 1500 1000 Minimalist Trading - Indicators for TradingView

Stop Guessing, Start Winning: The Best Trend Indicator on TradingView

Are you tired of playing guessing games in the market?

It’s time to level up your trading and move from the realm of uncertainties to confident wins.

And guess what?

We’re about to discuss a very popular indicator that might change the way you perceive trends and trading strategies. In fact, this indicator is a Top Trend Indicator on TradingView — let’s talk about the Breakout Pivotal Bars.

So, what exactly is the Breakout Pivotal Bars indicator, and why should you care?

Well, to put it simply it’s a very popular Trend Indicator for TradingView that’s simple to use, long-validated, and incredibly reliable.

Stop Guessing, Start Winning

Let’s cut to the chase. You’re here for a reason—to find that ultimate trend indicator that separates the consistent winners from the rest. The Breakout Pivotal Bars is designed to do just that. It’s not your run-of-the-mill indicator; it’s a game-changer.

But hold on, you might wonder, how does this trend indicator stand out from the rest in TradingView?

How do you identify Trend in TradingView?

Identifying trends in the market is like deciphering a code.

But fear not!

The Breakout Pivotal Bars simplifies this process. It detects pivotal moments, highlighting trend shifts with clear colors and remarkable precision.

Therefore, you can spot trends early, ride the waves, and make well-informed decisions.

Trend Indicator TradingView - Breakout Pivotal Bars - Minimalist Trading

Trading Setup with the Breakout Pivotal Bars (Trend Indicator for TradingView) on EURUSD

As the EURUSD 5m setup above shows, spotting trends and trend shifts is incredibly easy and the Breakout Pivotal Bars maintained the red and green colors through the entire trends.

But that’s just the beginning!

How to Build Profitable Setups with the Trend Indicator

Look: Identifying the trend is just the first step. The real power lies in leveraging this information to create winning setups.

By combining the Breakout Pivotal Bars with another indicator like the Sentiment Index, you can craft incredibly profitable setups.

Let’s reconsider the previous chart and shift it back a little bit earlier right before the downtrend started.

How did the setup formed?

Trend Indicator TradingView - Breakout Pivotal Bars & Sentiment Index - Minimalist Trading.png

Trading Setup with the Breakout Pivotal Bars (Trend Indicator for TradingView) and the Sentiment Index on EURUSD

On top, we have the Price that forms a consolidation (highlighted with purple lines on top).

Simultaneously, at the bottom, the Sentiment Index forms a consolidation as well (highlighted with purple lines at the bottom).

The setup is forming because we know for sure that after every consolidation a breakout occurs – we simply need to be patient!

What happens next is key:

  • Step 1: The Price breaks down its consolidation (purple circle “1”).
  • Step 2: The Sentiment breaks down its consolidation (purple circle “2”).
  • Step 3: The candles turn from green to red (colored by the Breakout Pivotal Bars).

It’s a perfect sell setup with the Breakout Pivotal Bars and the Sentiment Index waiting to be traded down.

And remember — you can get a 1-Week Free Trial of all Minimalist Trading indicators to explore their full potential right now.

The Result? Consistent Wins

Let’s talk results — how profitable is the trend indicator?

Here’s the bottom line: Incorporating the Breakout Pivotal Bars (and the Sentiment Index) into your trading strategy can transform your trading game.

It turns into making informed decisions based on precise trends, leading to more profitable trades and, ultimately, consistent wins.

Why Does This Matter?

That’s a legitimate question!

Well, in the unpredictable world of financial markets, having an edge can make all the difference. The Breakout Pivotal Bars offers that edge by simplifying trend identification and allowing you to navigate the markets with more confidence and clarity.

In Conclusion

To sum up, a trend indicator for TradingView like the Breakout Pivotal Bars is more than just another tool in your trading arsenal.

It could be a game-changer, providing a clearer path through market trends and potentially leading to consistent wins.

Sign up for a 1-week trial (completely free) and witness firsthand how this indicator can elevate your trading strategy.

Trend Exhaustion Indicator: a game-changing Trading Setup

Trend Exhaustion Indicator: a game-changing Trading Setup 1500 1000 Minimalist Trading - Indicators for TradingView

Trend Exhaustion Indicator

A game-changing Trading Setup

A Trend Exhaustion Indicator is a trader’s best friend. In fact, it’s hard to jump in and out of trends at the right time.

But, what if you could do it easily?

In this article, you are going to learn how to use a Trend Exhaustion Indicator which, by the way, is also one of the best TradingView indicators, and you will also learn how to exploit it in an actual Trading Setup.

First, the indicator!

The Trend Exhaustion Indicator that we’re going to use is the Breakout Pivotal Bars which constantly analyses trends, identifying when they begin and end.

Some traders even use this indicator on its own considering its capability of offering an easy-to-use trading strategy however, in this article we’ll discover how to maximize its potential.

So, how can we do that?

We combine the Breakout Pivotal Bars with a second extremely popular TradingView indicator, the RSI Exhaustion.

The RSI Exhaustion is an essential replacement for the standard RSI indicator because it is also able to identify and highlight exhaustion levels.

Let’s see with an actual example how to start from a Trend Exhaustion Indicator and develop a game-changing Trading setup.

The following chart shows the EURUSD price action on a 1h timeframe.

Let’s ignore for a second the RSI Exhaustion indicator at the bottom, and focus instead on the price action above.

Notice anything?

The Breakout Pivotal Bars, by coloring the candles, clearly identifies in real-time both a major uptrend and a subsequent downtrend.

Great, but what are the rules to identify both the beginning and the exhaustion of both trends?

This is when the RSI Exhaustion comes into play in combination with the Breakout Pivotal Bars.

Let’s focus on the purple area in the chart below which highlights the beginning of the uptrend.

Before the uptrend starts, the RSI Exhaustion at the bottom of the chart is moving sideways and it is mostly colored red which means that the downward movement might soon be over (bearish exhaustion).

The actual trigger, however, is what happens just after!

The RSI Exhaustion spikes up, the price suddenly moves up as well, and the candle’s color turns from red to green.

This is a clear signal of a new uptrend beginning.

The most attentive traders might argue that the RSI Exhaustion at the bottom turns green, which means bullish exhaustion, and thus the upward move might soon be over.

Correct, however, you should also remember that a trend might continue to move in its direction for a prolonged period of time even if there is exhaustion along the way.

The good news?

It is possible to clearly identify when the trend’s strength is exhausting and so lock in the profits before the trend reverts.

To understand this, let’s focus on what happens next as shown in the purple area below.

The trend is moving up forming green and blue candles (discussed at the end), and similarly to when it started, at a certain point the candles turn red, the RSI Exhaustion drops, and even turns red (bearish exhausted).

However, do you notice anything else?

Before giving the actual signal, a divergence between the price and the RSI Exhaustion formed, in fact, the price was moving up, while the RSI Exhaustion was moving down.

This is always a great indication that the trend is about to end and possibly reverse.

As an extra bonus, even if not strictly required, the RSI was even colored green so bullish exhausted!

Combine the divergence with the actual trend exhaustion signal that arrived some candles later and you have a clear rule that can be consistently exploited as a trade setup.

Similarly, the new downtrend got exhausted after the price was continuously moving down, while the RSI Exhaustion was moving pretty flat.

And, guess what?

Shortly after, the candles changed color from red to green again – yet another trade signal!

To sum up, thanks to the combination of the Breakout Pivotal Bars and the RSI Exhaustion, it was possible to clearly identify two buy and one sell signals and, even more, it was possible to predict the signals in advance.

Needless to say, the buy and sell signals are also the best time to close the trade should you have one open and lock in your profits.

Some might ask: “What if I don’t trade on forex or I don’t trade on 1h charts“?

No problem!

In fact, all Minimalist Trading indicators automatically self-optimize based on the asset and timeframe that you have on your chart.

This means that they will always perform at their best.

Of course, we cannot encourage you more to start with a 1-week free trial, which allows you to test yourself the Breakout Pivotal Bars, the RSI Exhaustion, as well as our other popular TradingView indicators.

One last thing!

If the green candles are an indication of an uptrend, and the red candles of a downtrend, how to interpret the blue candles?

It’s pretty simple – the blue candles could mean either a trend continuation or a trend reversal. In practical terms, you should simply need to pay closer attention when they appear.

For example, during the uptrend that we discussed above multiple blue candles appeared however, there was no indication of a trend reversal. Additionally, the blue candles were all followed by green candles which, in an uptrend, is the typical scenario of trend continuation.

After learning these simple rules, many fellow traders have started to use this game-changing Trade Setup and even tweak it according to their personal style.

Now it’s your turn to become a minimalist trader and start exploiting each new trend exhaustion!


Trading setup summary

Scenario YOU ARE LOOKING TO…

Close a short trade after a downtrend
OR
Jump into a new uptrend

YOU ARE LOOKING TO…

Close a long trade after an uptrend
OR
Jump into a new downtrend

Condition 1 Divergence between price (moves down) and RSI Exhaustion (moves up or sideways) Divergence between price (moves up) and RSI Exhaustion (moves down or sideways)
Condition 2

[optional but better to have]

RSI Exhaustion: bearish exhausted (red) RSI Exhaustion: bullish exhausted (green)
Condition 3 Breakout Pivotal Bars change color (from red to green) Breakout Pivotal Bars change color (from green to red)

A very simple and profitable Trading Setup(commented) - Minimalist Trading

A very simple and profitable Trading Setup

A very simple and profitable Trading Setup 2656 1326 Minimalist Trading - Indicators for TradingView

A very simple and profitable
Trading Setup

Our long-time traders know that we always strive for simplicity in trading the markets.

Today we couldn’t be more excited to share a very simple and profitable trading setup with the Advanced Signal Bars.

As you may know, the Advanced Signal Bars is one of the Best TradingView indicators because it’s simple to use and very adaptable to many strategies.

Today we want to keep it extremely simple!

So, let’s see how to build the setup.

The secret?

Building the setup is very easy!

All it takes is to add two indicators to your chart:

  • The Advanced Signal Bars, which is available in our suite of indicators.
  • The Moving Average, which is available for free on TradingView.

You can adjust the length of the Moving Average to be whichever better suits your trading risk, but we suggest you to keep it relatively long.

In our case, we set the Moving Average to be 54, which seems like a good compromise.

A very simple and profitable Trading Setup - Minimalist Trading

As you can immediately tell from the EURUSD 1h chart above, when the price is above the moving average, there are mostly red horizontal lines.

When, instead, the price is below the moving average, there are mostly green horizontal lines.

This is exactly what we’re looking for because we can build a simple and profitable setup based on this evidence.

So, let’s see the BUY and SELL rules of our setup.

BUY rules

  1. Price is above the moving average (54)
  2. Candle breaks up and closes above a red horizontal line

SELL rules

  1. Price is below the moving average (54)
  2. Candle breaks down and closes below a green horizontal line

Let’s now highlight the BUY and SELL conditions in the EURUSD 1h chart that we’ve seen before.

A very simple and profitable Trading Setup(commented) - Minimalist Trading

As you can see from the labels on the chart, over a 2-month period we’ve had 25 trading opportunities.

The 13 BUY opportunities came only during the uptrends, and the 12 SELL opportunities triggered exclusively during the downtrends.

If we then look closely, we can see that 24 out of 25 opportunities were profitable, allowing us to say that this simple setup was profitable 96% of the times over a 2-month period.

The only loss was the BUY opportunity number 8, which came at the very top.

Luckily though, most of the time, at market extremes we won’t get a false opportunity: consider for example what happened at the end of the first downtrend.

The price sank but at the very bottom we didn’t get any false sell opportunity 😉

Before we conclude, let us give you a few suggestions to maximize your performance.

1. Trade on long timeframes

We strongly recommend using the setup on a timeframe of 1h (like in our example) or above (e.g., 4h, 1d, …).

To day traders it might sound boring but you will be amazed by how consistently profitable the setup could be.

Moreover, you decrease your stress level by taking less but consistently profitable opportunities.

2. Use a relatively long moving average

A short moving average will often introduce noise and may trigger too many false signals.

To minimize the losses, simply increase the moving average length.

In our case, we used 54, which is a good compromise.

3. Don’t be too strict with the Stop Loss and Take Profit levels

If you set a very strict Stop Loss, you will end up losing many profitable trades.

Similarly, if you set a very strict Take Profit, you will miss out on bigger profits.

The general idea of this setup is to give space for the price to move, knowing that, most of the time, it will continue to trend in the same direction.

A rule of thumb is to set the Stop Loss before the last retracement or extreme but, of course, it comes down to your own risk-attitude to find the balance between Risk-Reward and Win-Loss ratios.

We just learned a very simple and profitable trading setup using the Advanced Signal Bars and the Moving Average.

Now it’s your turn so go ahead and start testing it yourself!

Of course, if you have any questions, don’t hesitate to contact us.

3 Trading Setups with the Bottoms Tops Signal Toolkit – Featured

3 Trading Setups with the Bottoms Tops Signal Toolkit

3 Trading Setups with the Bottoms Tops Signal Toolkit 1920 1080 Minimalist Trading - Indicators for TradingView

3 Trading Setups with the
Bottoms Tops Signal Toolkit

What if you know 3 Trading Setups with some of the best indicators for TradingView, used every single day by many day traders and swing traders for their technical analysis and trading activity?

Our Bottoms Tops Signal Toolkit is the combination of the Bottoms Tops Signal and the RSI Exhaustion.

This combination is not only very simple to read but it is also extremely powerful by offering a full variety of trading setups which can be easily integrated into multiple strategies.

The good news?

You will be able to exploit these 3 Trading Setups straight away on any asset and on any timeframe.

But that’s not all!

In fact, one setup does not exclude the other! Once you learn these 3 Trading Setups, you can easily switch between the setups depending on the specific situation you see on your chart.

So, let’s discover them by starting with the first.

Setup 1 –

The first setup is a very popular one and allows you to identify only the best opportunities the Market has to offer by exploiting the Bottoms Tops Signal and the RSI Exhaustion.

3 Trading Setups with the Bottoms Tops Signal Toolkit – Setup 1-2

As you can see from the chart above, there are several Bottoms and Tops opportunities on this ETHUSD 60m chart. However, among those, there are two big opportunities (circled in blue) which have the highest probability and the greatest returns.

Of course, many traders exploit even the other Bottoms and Tops but as you can see from the chart, they offer minor opportunities in respect to the two circled.

So, how to identify only the best and most likely?

It’s very simple because it takes just three simple rules!

3 Trading Setups with the Bottoms Tops Signal Toolkit – Setup 1-3

BUY rules (example)

  1. A Bottom appears
  2. RSI grows with the price (see how the two blue trend lines that we draw have the same slope)
  3. RSI is Exhausted

What we see in the situation above is that a Bottom gets identified and the RSI is progressively growing with the price meaning that the up-move can be supported. Finally, the RSI becomes bear exhausted (coloured in red) which means that the price doesn’t have much more room to go down.

Every time you see these three conditions, you are sure to have a very likely big opportunity!

The second opportunity is even better.

3 Trading Setups with the Bottoms Tops Signal Toolkit – Setup 1-4

SELL rules (example)

  1. A Top appears
  2. RSI and the price have a big divergence (see how the two blue trend lines that we draw have opposite slopes)
  3. RSI is Exhausted

What we see in the situation above is that a Top gets identified and the RSI forms a divergence with the price meaning that the current price level is not sustainable. Finally, the RSI becomes bull exhausted (coloured in green) which means that the price doesn’t have much more room to go up.

With three simple rules, out of multiple Bottoms and Tops, you are now able to identify only on those opportunities which are most likely and offer the greatest return.

Setup 2 –

The second setup is less frequent but very powerful especially when you want to identify and exploit major shifts in the Market.

The following chart shows the EURJPY pair on a daily timeframe.

3 Trading Setups with the Bottoms Tops Signal Toolkit – Setup 2-1

As you can see straight away, almost every Market extreme was correctly identified by the Bottoms Tops Signal either with a Top or a Bottom so you could have exploited those opportunities right away.

But there’s a lot more.

3 Trading Setups with the Bottoms Tops Signal Toolkit – Setup 2-22

The pair has been in a big downtrend until around mid-2016. Then it entered in an upward consolidation which lasted for about a year until it finally took off in Jun 2017.

What happened in June, right before the take-off, is the setup you are about to learn.

Even in this setup, there are a few simple rules which create the opportunity, so let’s see them.

Major shift rules (example)

  1. RSI goes oversold (or almost) and is bear exhausted (coloured red)
  2. RSI goes overbought (or almost) and is bull exhausted (coloured green) + New high
  3. RSI goes bear exhausted again around 50 + Bottom

So, what happens is that the RSI first makes a peak down becoming oversold and simultaneously exhausted. Then it makes a new peak on the opposite side by becoming overbought and simultaneously bull exhausted. Lastly, it goes down again to around 50 and becomes bear exhausted while a new bottom appears.

The situation above is indicative of a very major move in the Market, in fact, since that moment the EURJPY gained almost 1500 pips until the end of the year.

It is a situation appreciated by Elliott Wave traders because this setup is able to identify Wave-3 and Wave-5 which, in Elliott Wave theory, are notoriously the most profitable and less risky.

Setup 3 –

The third and last setup is for those traders who keep an open mind and see things differently.

In case of major trends, the Bottoms Tops Signal might identify several opportunities which then get invalidated by the Market because the price keeps pushing in the same direction.

Every professional trader knows a simple quote

The trend is your friend

So why going against?

For this setup, we need to be sure to have the “Suggested Close” icons visible on our chart. To do so, simply go into the Settings of the Bottoms Tops Signal and then be sure to enable “Show Suggested Close” under the Inputs tab.

3 Trading Setups with the Bottoms Tops Signal Toolkit – Setup 3-2

Once you enable it you will see X signs appearing on your chart (for the sake of this article we made them very big in the chart above).

The X signs represent the suggested close so, for instance, considering the first X in the chart above, if you took the bottom just before it, you should close your position when the X appears.

However, the opportunity was rather small and the others even led to losses.

So what can you do?

You know that we are in a downtrend because we had a Top (on the left of the chart) and the price has been falling since so, instead of taking the Bottoms trying to fight the trend, you take the suggested closes of those Bottoms like they were Top opportunities.

3 Trading Setups with the Bottoms Tops Signal Toolkit – Setup 3-3

In the chart above we highlighted the opportunities with red triangles just above the candles with the X.

As you can see, you can turn a very unfriendly trend into a very profitable run down by exploiting each of the six opportunities (or the ones that align with your strategy).

But there’s even more to tell.

This Setup is a very safe approach to trading the Markets for two reasons.

First, because you trade only when you have enough evidence: there was a Top and the price has been falling since so, we are clearly in a down-trending bearish market.

Second, because it is extremely likely that the last Bottom in the downtrend will not be invalidated (like in the chart above).

What does this mean?

It means that you will not take a new position when the trend is ending and you will preserve your account.

Essentially, you ride the trend all the way down (or up) until there is room to go. Then, you wait for a new extreme to appear, a new trend to form and new opportunities to be exploited.

You just learned 3 Trading Setups with the Bottoms Tops Signal and the RSI Ehxuastion that are profitably exploited every single day by many fellow traders on TradingView.

Of course, the more you use the indicators, the more you will learn to identify those setups and even define new ones according to your strategy.

We regularly receive feedback from fellow Traders who exploit our famous indicators in new creative ways.

If you are among those, feel free to contact us and we’ll be happy to create a new article around your setup and share it back with the whole trading community.

Exclusive Trading Setup

Exclusive Trading Setup

Exclusive Trading Setup 6000 4000 Minimalist Trading - Indicators for TradingView

💎
Exclusive Trading Setup

It takes time and dedication to build a profitable trading setup with proven results.

But what if you could do that with a few, simple and non-subjective rules?

In this article, you will learn how to build and identify a trading setup with proven results.

The following chart from TradingView – USDJPY, 15min – has a trading opportunity which you are about to master and you’ll never miss again next time.

The good news?

Setups like this form every single day on any asset and on any timeframe!

Minimalist Trading – Exclusive Trading Setup – USDJPY chart

So, do you see the opportunity? 

Let us explain what you should be looking for.

Minimalist Trading – Exclusive Trading Setup – Impulse-consolidation-impulse(scheme)

The market always, always, ALWAYS moves by cycles of an impulse followed by a consolidation followed by another impulse.

As you can understand from the scheme above, impulses are the ones to exploit because they offer a significant price movement in a short period of time. 

On the contrary, consolidations should be avoided because price movements are limited and may take a long time.

Let’s now overlap the previous schema to our chart. 

Minimalist Trading – Exclusive Trading Setup – Impulse-consolidation-impulse(chart)

As you can see, the opportunity now starts to take shape so let’s dive into the setup!

First of all, we need the three trading indicators which make up the setup:

Actually, the setup is built with only two indicators (Breakout Pivotal Bars and Sentiment Index) with the third one (Levels and Zones) being used for extra confirmation.

Minimalist Trading – Exclusive Trading Setup – USDJPY chart with indicators and commented setup

The chart above shows the actual trading setup.

The rules are very simple and non-subjective. Here they are for a sell setup like the one in the chart above (for a buy setup the rules are simply the opposite).

Rule Indicator Condition
Rule 1 Breakout Pivotal Bars Price breaks-down consolidation on a red candle
Rule 2 Sentiment Index Bearish Sentiment breaks-down
Rule 3 Levels and Zones Price is below a resistance

All it takes are these three simple non-subjective rules.

Exactly the same setup repeats itself over and over, every single day, on any asset and timeframe.

For example, the following chart shows eight identical opportunities on BTCUSD 240m. 

Minimalist Trading – Exclusive Trading Setup – BTCUSD chart with indicators and commented setup

Let’s analyze the eight trading opportunities one by one. 

Setup #1 
Rule 1. Break-up of consolidation
Rule 2. Break-up of Bullish Sentiment
Rule 3. Above Support
=> GOOD OPPORTUNITY

Setup #2 

Rule 1. Break-up of consolidation
Rule 2. Break-up of Bullish Sentiment
Rule 3. Above Support
=> GOOD OPPORTUNITY

Setup #3 

Rule 1. Break-up of consolidation
Rule 2. Break-up of Bullish Sentiment
Rule 3. No Support nearby!
=> VALID OPPORTUNITY but pay attention

Setup #4 

Rule 1. Break-up of consolidation
Rule 2. Break-up of Bullish Sentiment
Rule 3. Resistance Above!
=> VALID OPPORTUNITY but pay attention

Setup #5 

Rule 1. Break-down of consolidation
Rule 2. Break-down of Bearish Sentiment
Rule 3. Below Resistance
=> GOOD OPPORTUNITY

Setup #6 

Rule 1. Break-down of consolidation
Rule 2. Break-down of Bearish Sentiment
Rule 3. Support is pretty far!
=> GOOD OPPORTUNITY

Setup #7 

Rule 1. Break-down of consolidation
Rule 2. Break-down of Bearish Sentiment
Rule 3. Support is pretty far!
=> GOOD OPPORTUNITY

Setup #8 

Rule 1. Break-down of consolidation
Rule 2. Break-down of Bearish Sentiment
Rule 3. Support is still pretty far!
=> GOOD OPPORTUNITY 

If you’re wondering what the blue candles mean, they represent indecision so either trend continuation or imminent trend reversal. Depending on your overall trading strategy you can decide to trade them or not. 

Now, if the examples above are not enough you can have a look at the several real-time trading ideas that we published on our TradingView profile (by the way, be sure to follow us on TradingView!).

Here’s a selection of those (once you open an idea scroll down to read the updates).

Trading Idea 1
Trading Idea 2
Trading Idea 3
Trading Idea 4
Trading Idea 5
Trading Idea 6
Trading Idea 7
Trading Idea 8
Trading Idea 9
Trading Idea 10

Let’s be honest, it could (rarely) happen that an opportunity will end up reversing. 

But that’s not all bad. 

In fact, if the price reverses, chances are it will continue impulsively in the same direction. 

See this Trading idea on EURUSD – price reversed, offered an opposite opportunity, and continued in the same direction.

So the vast majority of times this setup is very likely to hit the Trading Target.

On the unfortunate occasion that the price reverses, it is then very likely to continue impulsively in that same direction!

Isn’t that great? 

The only thing left is that you put the Exclusive Trading Setup to work! 

Of course, always feel free to contact us should you have any questions.

Predict Market moves with one Indicator – Levels and Zones – Commented

Predict Market moves with One Indicator

Predict Market moves with One Indicator 1519 870 Minimalist Trading - Indicators for TradingView

Predict Market moves
with One Indicator

When you have the right tools, Markets become simple to read and you start realising that they offer repetitive opportunities which just can’t be missed. Even with one single indicator, you can constantly predict Market moves profiting from them and this article will show you exactly how.

The following image shows the BTCUSD pair on a 60m timeframe in April 2018. At first sight, it looks like a regular market activity without any predictable significant opportunity, however, there is a very big opportunity and when you learn to identify it, you won’t miss it again!

Predict Market moves with one Indicator – BTCUSD ChartBTCUSD 60m – April 2018

Let’s add to the chart one indicator, the Levels and Zones, which is able to identify in real-time the best support and resistance levels as well as their corresponding long and short zones.

Predict Market moves with one Indicator – Levels and ZonesBTCUSD 60m – April 2018 (with Levels and Zones indicator)

What before was a rather anonymous price action, instantly starts to be shaped by the levels that constantly support or constrain every price movement.

It immediately becomes obvious to the eye that the price fluctuations are sustained by really strong supports at the bottom which prevent the price from falling under, however, this very quick analysis is not sufficient to predict the very sudden 20% upward move (in a matter of hours!) that followed.

So how can you predict Market moves like this?

Let’s further analyse the chart describing, step-by-step how such situation formed.

Step 1

The Resistance at the top of the chart moves down, hence pushing prices lower. Think of this as an obstacle to move higher.

Step 2

The Support at the bottom of the chart slightly moves higher, hence pushing prices higher. Think of this as an obstacle to move lower.

Step 3

Price is forced to move in a very tight channel and, just like in the real world when something is forced into a tight space, upward pressure builds up.

Step 4

An upward explosion takes place determining a massive and sudden breakout.

Predict Market moves with one Indicator – Levels and Zones – CommentedBTCUSD 60m – April 2018 (with Levels and Zones indicator and comments)

When you have an indicator like the Levels and Zones, it is easy to identify when and where the pressure is building up and situations like the one described above occur every single day in the Market. For instance, the following is a similar situation on EURUSD in January 2018.

Predict Market moves with one Indicator – EURUSD Chart – CommentedEURUSD 60m – January 2018 (with Levels and Zones indicator and comments)

The situation is almost identical to the setup analysed above and, in this case, pressure blows off into a 300 pips movement which is not as sudden as the one on BTCUSD but it is still an impulsive movement so, in a relatively short amount of time (x-axis), you get a very significant price fluctuation (y-axis).

Being able to consistently identify situations where big movements are about to happen can turn a choppy track record into a very profitable performance over the long term.

The Levels and Zones was developed exactly for this: to predict Market moves by identifying the most significant levels where price is likely to bounce, stop or break.

2 Trading Setups with the Sentiment Index

2 Trading Setups with the Sentiment Index

2 Trading Setups with the Sentiment Index 1531 858 Minimalist Trading - Indicators for TradingView

2 Trading Setups with the
Sentiment Index

I think you’ll agree when I say that one of the most difficult tasks when reading a chart is to understand the real sentiment of the Market participants.

What if you can do it with a really simple and intuitive indicator?

In this article, you’ll learn two popular Trading Setups with the Sentiment Index, one of the best Trading Indicators for TradingView.

The Sentiment Index was developed to reveal the actual Sentiment of the market in real-time.

Even a beginner trader can now understand the real Sentiment, be it positive or negative, and adjust his trades accordingly.

The best part?

These two Trading Setups with the Sentiment Index work on any chart!

In fact, all our popular Trading Indicators for TradingView were developed to work on any asset and on any timeframe.

So, let’s get to the setups!

2 Trading Setups with the Sentiment Index

Setup #1 – Divergence

The first setup is highlighted in red in the chart above.

This setup is very intuitive and always straightforward to identify.

The price is initially in a quite significant downtrend, from around $71 to about $64.

However, the negative Sentiment Index is trending up rather than down.

This means that the price and the Sentiment Index are diverging and the down movement should not be trusted.

In fact, a similar condition is always a great indication that the current price movement is losing strength and a market reversal is due soon.

As you can see from the chart above, as soon as the Sentiment turns positive (green) a new significant uptrend takes place.

So, the rules for this setup are very simple.

For an uptrend due soon:

  • The price is moving down
  • The negative Sentiment Index is moving up

For a downtrend due soon:

  • The price is moving up
  • The positive Sentiment Index is moving down

Let’s now see the second setup.

Setup #2 – Convergence

The second among the two Trading Setups with the Sentiment Index is similar but even better.

Why?

Because you can easily identify the exact moment in which you should enter a new trade.

This second setup is highlighted in green in the chart above.

Initially, we have a very strong uptrend and the positive Sentiment Index (green) is indeed weakening – not a good sign.

However, the uptrend stops and the price starts consolidating with an almost parallel movement.

Don’t be tricked by the movement: it could also be any other consolidation, hence even against the trend.

In this circumstance, we are able to draw a trendline, both on the price and the Sentiment Index (see the two green trendlines).

What happens next is that both the price and the Sentiment Index break up at the same time.

Just think of it!

The price moves up and the positive Sentiment Index moves up as well.

This is a great indication that the bullish movement is very likely to be sustained.

So, once the breakout is confirmed (always wait for the close of a candle!) you can enter your trade.

Let’s now review the rules of this second setup.

Uptrend confirmed:

  • The price breaks up
  • The positive Sentiment Index breaks up

Downtrend confirmed:

  • The price breaks down
  • The negative Sentiment Index breaks down

The two Trading Setups with the Sentiment Index explained in this article have been tested and exploited, across the years, by a countless number of fellow traders.

But that’s not all!

They keep appearing every single day across multiple assets and timeframes, even on yours!