
Trend Exhaustion Indicator
A game-changing Trading Setup
A Trend Exhaustion Indicator is a trader’s best friend. In fact, it’s hard to jump in and out of trends at the right time.
But, what if you could do it easily?
In this article, you are going to learn how to use a Trend Exhaustion Indicator which, by the way, is also one of the best TradingView indicators, and you will also learn how to exploit it in an actual Trading Setup.
First, the indicator!
The Trend Exhaustion Indicator that we’re going to use is the Breakout Pivotal Bars which constantly analyses trends, identifying when they begin and end.
Some traders even use this indicator on its own considering its capability of offering an easy-to-use trading strategy however, in this article we’ll discover how to maximize its potential.
So, how can we do that?
We combine the Breakout Pivotal Bars with a second extremely popular TradingView indicator, the RSI Exhaustion.
The RSI Exhaustion is an essential replacement for the standard RSI indicator because it is also able to identify and highlight exhaustion levels.
Let’s see with an actual example how to start from a Trend Exhaustion Indicator and develop a game-changing Trading setup.
The following chart shows the EURUSD price action on a 1h timeframe.
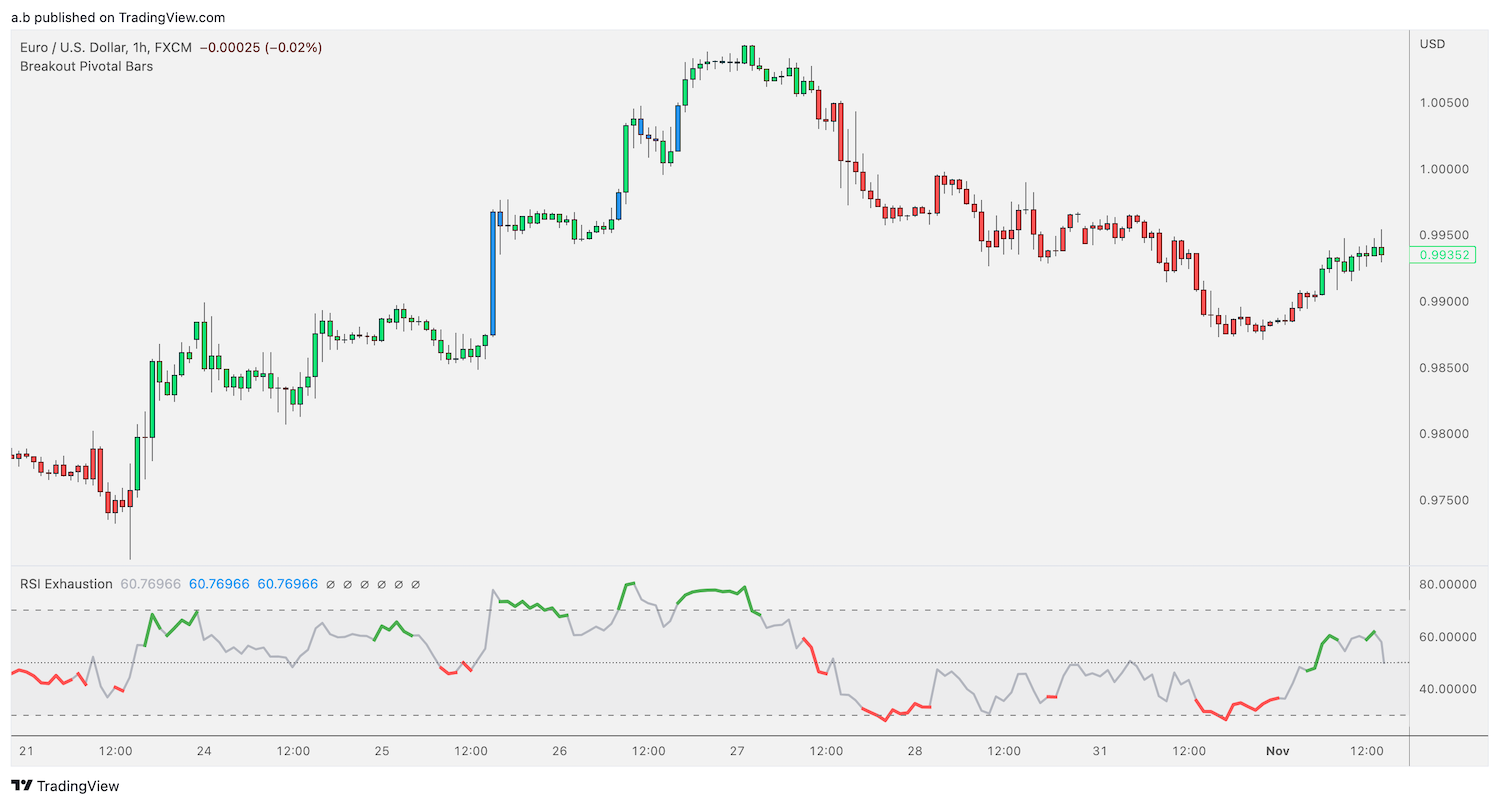 Let’s ignore for a second the RSI Exhaustion indicator at the bottom, and focus instead on the price action above.
Notice anything?
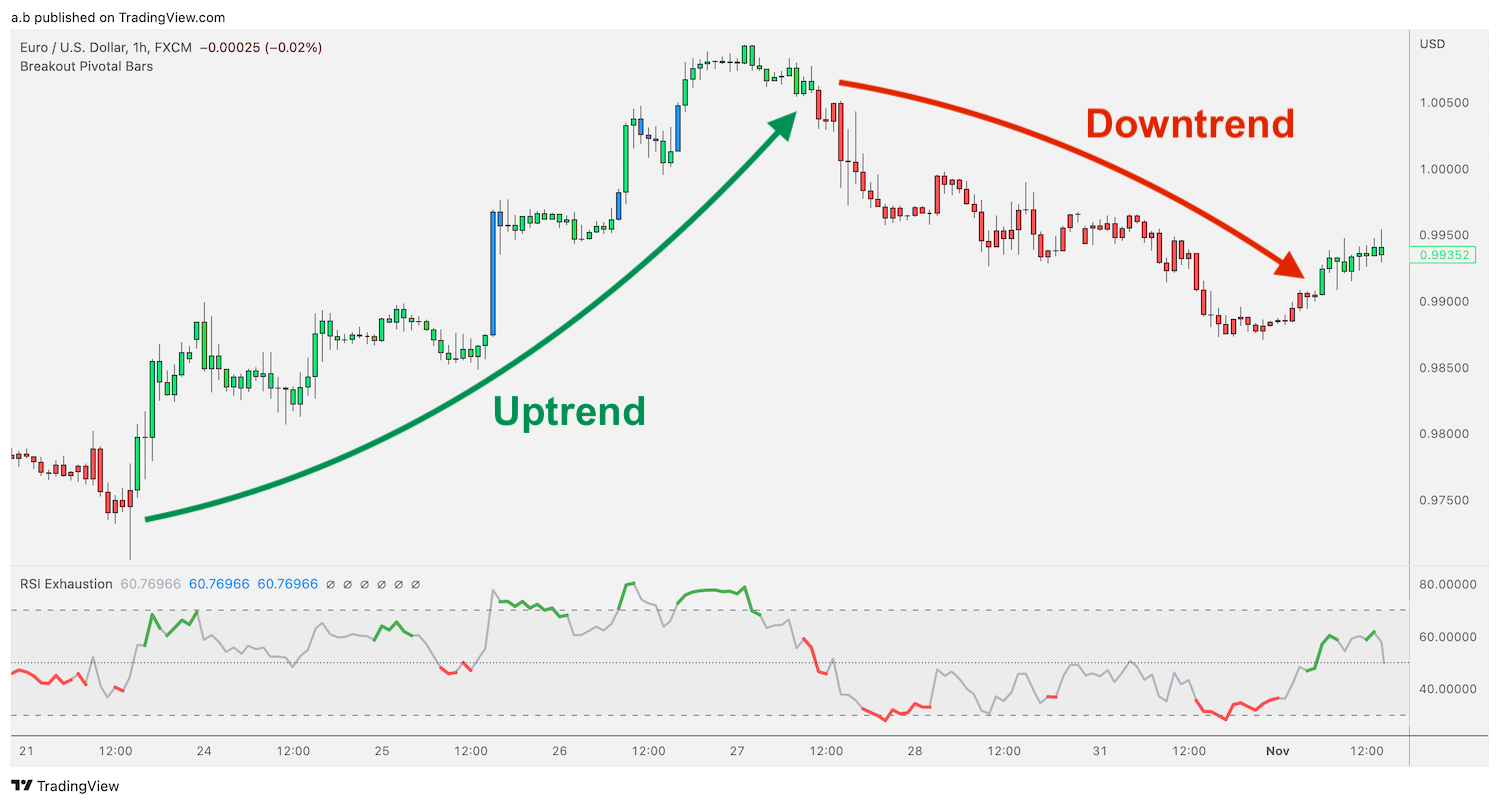 The Breakout Pivotal Bars, by coloring the candles, clearly identifies in real-time both a major uptrend and a subsequent downtrend.
Great, but what are the rules to identify both the beginning and the exhaustion of both trends?
This is when the RSI Exhaustion comes into play in combination with the Breakout Pivotal Bars.
Let’s focus on the purple area in the chart below which highlights the beginning of the uptrend.
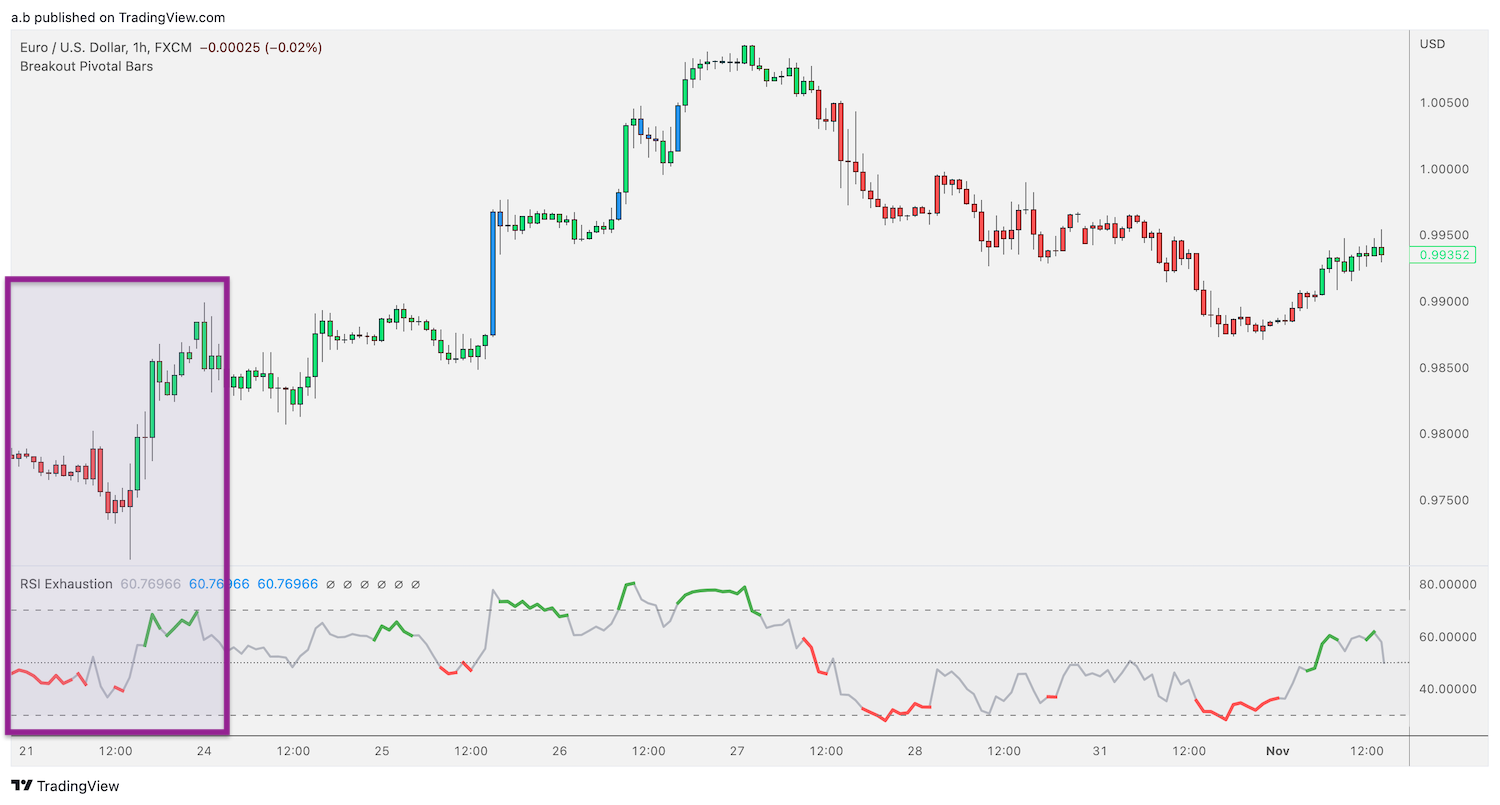 Before the uptrend starts, the RSI Exhaustion at the bottom of the chart is moving sideways and it is mostly colored red which means that the downward movement might soon be over (bearish exhaustion).
The actual trigger, however, is what happens just after!
The RSI Exhaustion spikes up, the price suddenly moves up as well, and the candle’s color turns from red to green.
This is a clear signal of a new uptrend beginning.
The most attentive traders might argue that the RSI Exhaustion at the bottom turns green, which means bullish exhaustion, and thus the upward move might soon be over.
Correct, however, you should also remember that a trend might continue to move in its direction for a prolonged period of time even if there is exhaustion along the way.
The good news?
It is possible to clearly identify when the trend’s strength is exhausting and so lock in the profits before the trend reverts.
To understand this, let’s focus on what happens next as shown in the purple area below.
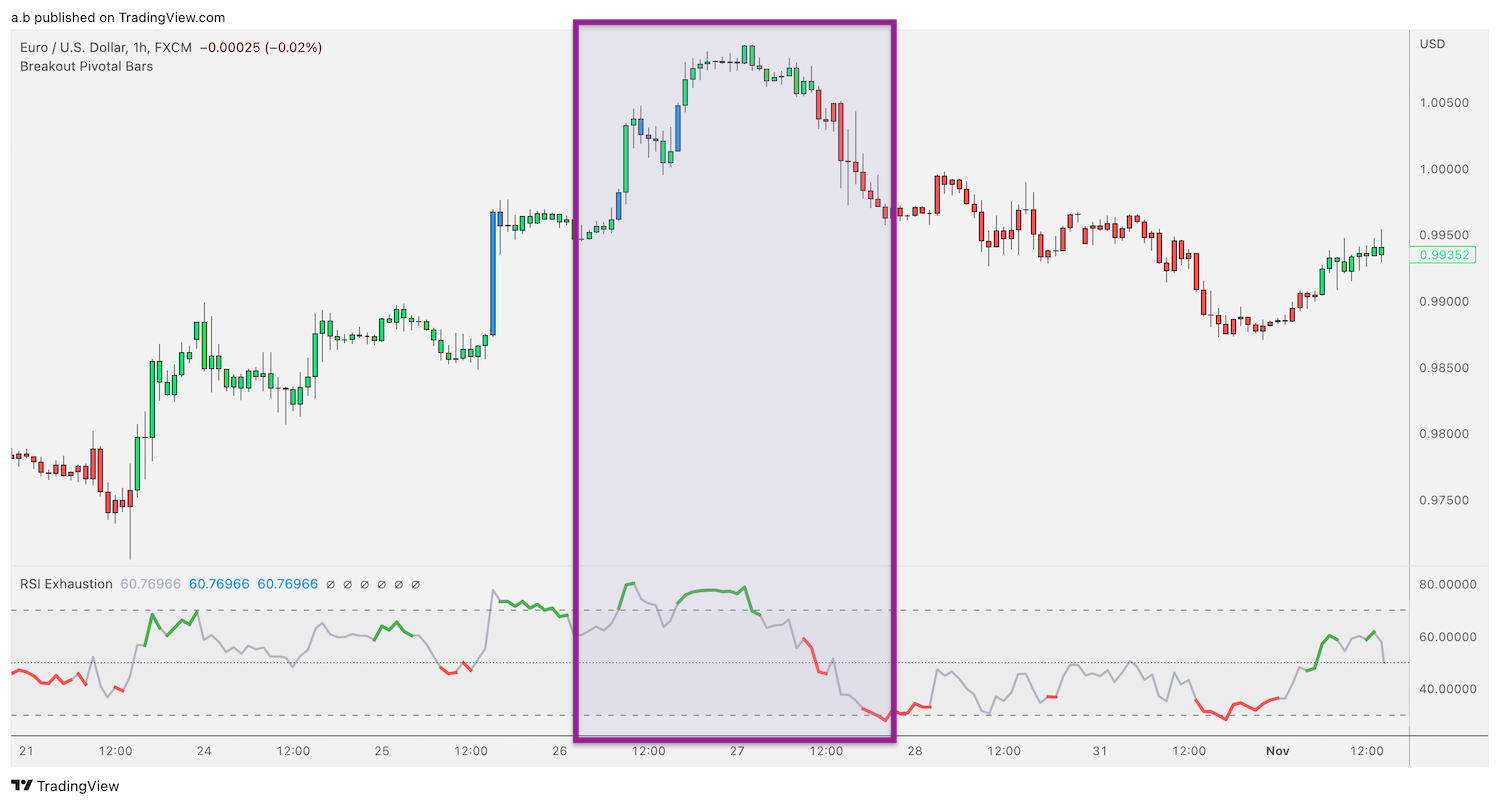 The trend is moving up forming green and blue candles (discussed at the end), and similarly to when it started, at a certain point the candles turn red, the RSI Exhaustion drops, and even turns red (bearish exhausted).
However, do you notice anything else?
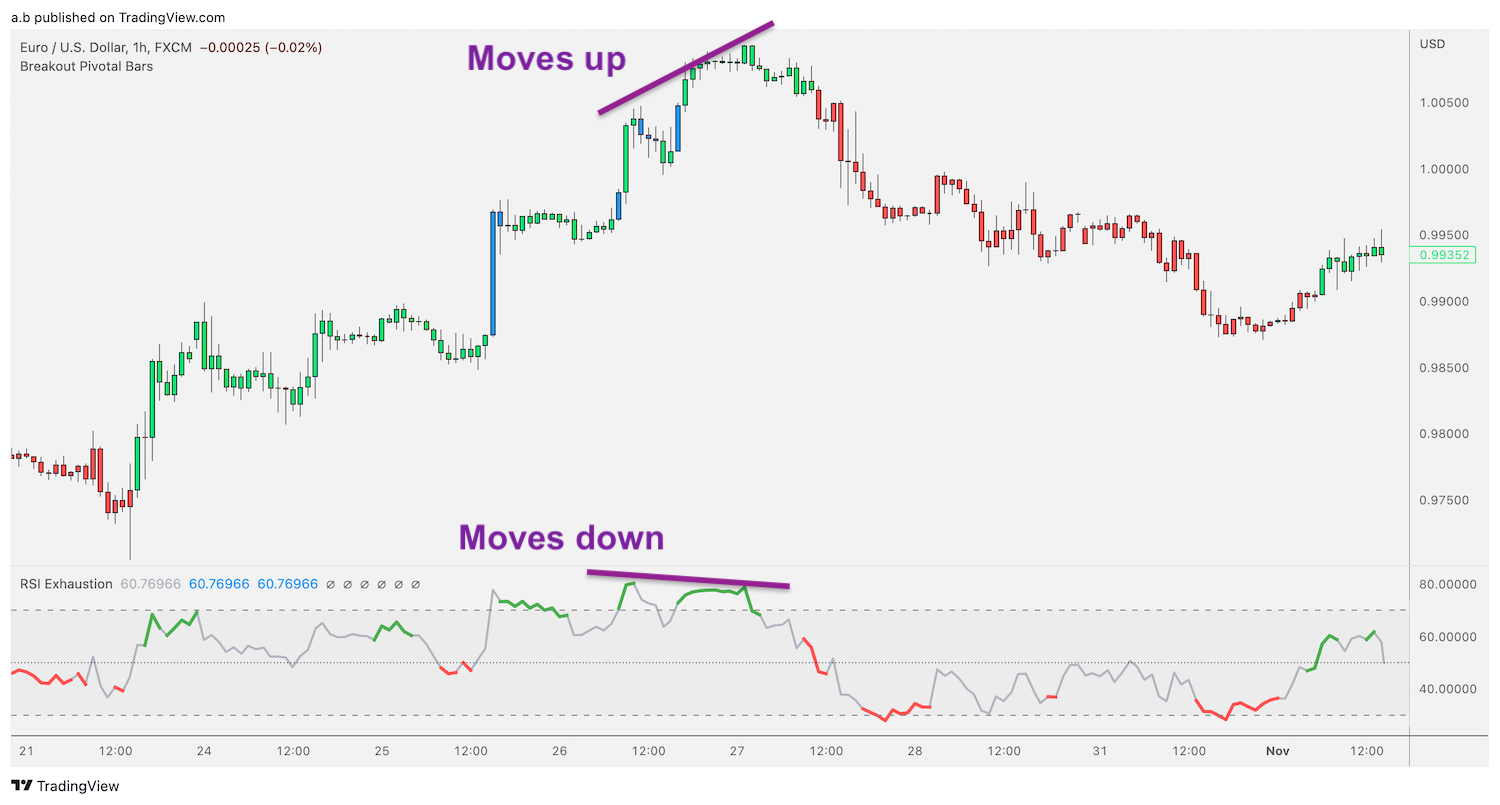 Before giving the actual signal, a divergence between the price and the RSI Exhaustion formed, in fact, the price was moving up, while the RSI Exhaustion was moving down.
This is always a great indication that the trend is about to end and possibly reverse.
As an extra bonus, even if not strictly required, the RSI was even colored green so bullish exhausted!
Combine the divergence with the actual trend exhaustion signal that arrived some candles later and you have a clear rule that can be consistently exploited as a trade setup.
Similarly, the new downtrend got exhausted after the price was continuously moving down, while the RSI Exhaustion was moving pretty flat.
And, guess what?
Shortly after, the candles changed color from red to green again – yet another trade signal!
To sum up, thanks to the combination of the Breakout Pivotal Bars and the RSI Exhaustion, it was possible to clearly identify two buy and one sell signals and, even more, it was possible to predict the signals in advance.
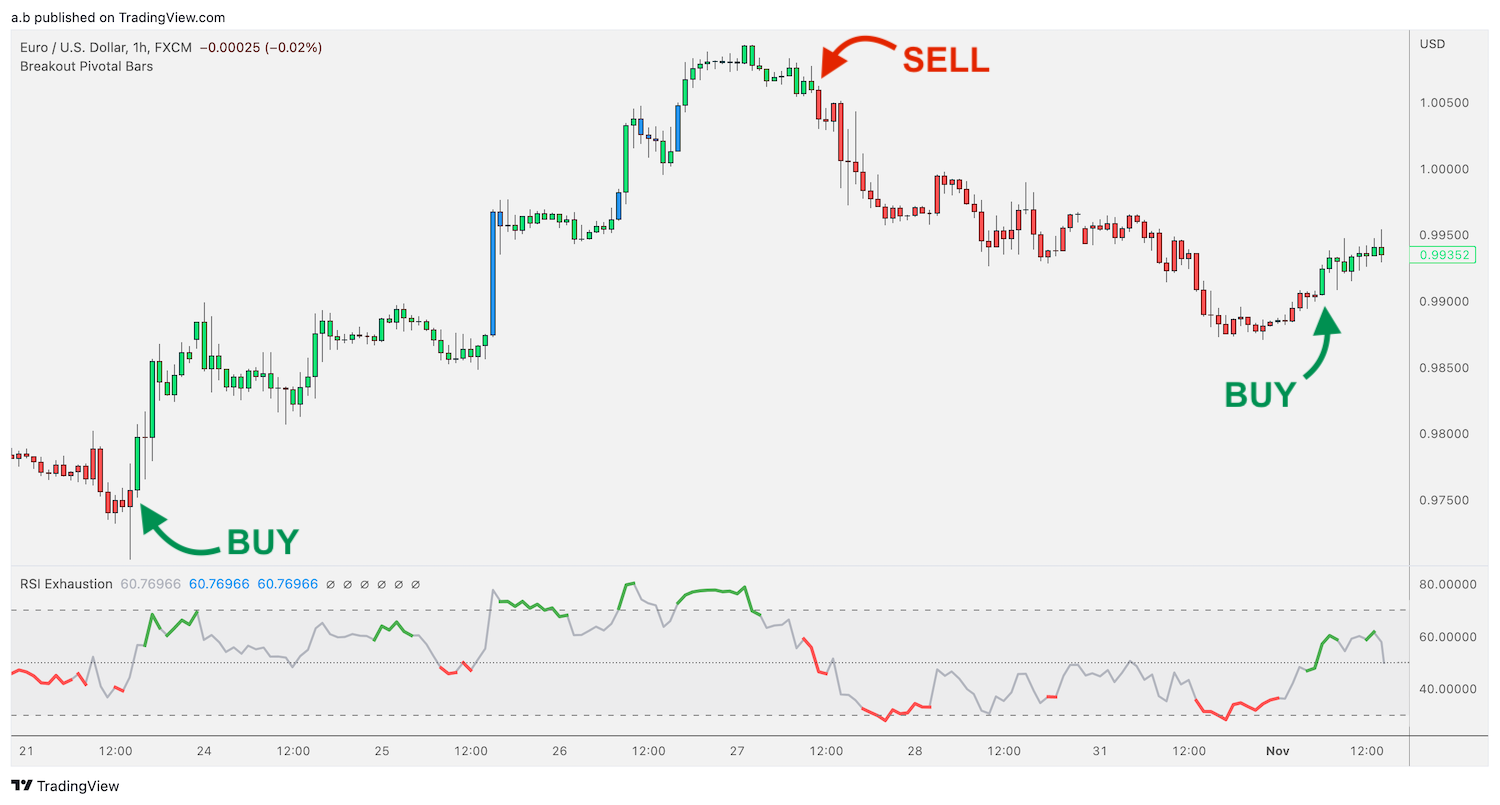 Needless to say, the buy and sell signals are also the best time to close the trade should you have one open and lock in your profits.
Some might ask: “What if I don’t trade on forex or I don’t trade on 1h charts“?
No problem!
In fact, all Minimalist Trading indicators automatically self-optimize based on the asset and timeframe that you have on your chart.
This means that they will always perform at their best.
Of course, we cannot encourage you more to start with a 1-week free trial, which allows you to test yourself the Breakout Pivotal Bars, the RSI Exhaustion, as well as our other popular TradingView indicators.
One last thing!
If the green candles are an indication of an uptrend, and the red candles of a downtrend, how to interpret the blue candles?
It’s pretty simple – the blue candles could mean either a trend continuation or a trend reversal. In practical terms, you should simply need to pay closer attention when they appear.
For example, during the uptrend that we discussed above multiple blue candles appeared however, there was no indication of a trend reversal. Additionally, the blue candles were all followed by green candles which, in an uptrend, is the typical scenario of trend continuation.
After learning these simple rules, many fellow traders have started to use this game-changing Trade Setup and even tweak it according to their personal style.
Now it’s your turn to become a minimalist trader and start exploiting each new trend exhaustion!
Trading setup summary
| Scenario | YOU ARE LOOKING TO…
Close a short trade after a downtrend |
YOU ARE LOOKING TO…
Close a long trade after an uptrend |
| Condition 1 | Divergence between price (moves down) and RSI Exhaustion (moves up or sideways) | Divergence between price (moves up) and RSI Exhaustion (moves down or sideways) |
| Condition 2
[optional but better to have] |
RSI Exhaustion: bearish exhausted (red) | RSI Exhaustion: bullish exhausted (green) |
| Condition 3 | Breakout Pivotal Bars change color (from red to green) | Breakout Pivotal Bars change color (from green to red) |


