
Predict Market moves
with One Indicator
When you have the right tools, Markets become simple to read and you start realising that they offer repetitive opportunities which just can’t be missed. Even with one single indicator, you can constantly predict Market moves profiting from them and this article will show you exactly how.
The following image shows the BTCUSD pair on a 60m timeframe in April 2018. At first sight, it looks like a regular market activity without any predictable significant opportunity, however, there is a very big opportunity and when you learn to identify it, you won’t miss it again!
 BTCUSD 60m – April 2018
Let’s add to the chart one indicator, the Levels and Zones, which is able to identify in real-time the best support and resistance levels as well as their corresponding long and short zones.
 BTCUSD 60m – April 2018 (with Levels and Zones indicator)
What before was a rather anonymous price action, instantly starts to be shaped by the levels that constantly support or constrain every price movement.
It immediately becomes obvious to the eye that the price fluctuations are sustained by really strong supports at the bottom which prevent the price from falling under, however, this very quick analysis is not sufficient to predict the very sudden 20% upward move (in a matter of hours!) that followed.
So how can you predict Market moves like this?
Let’s further analyse the chart describing, step-by-step how such situation formed.
Step 1
The Resistance at the top of the chart moves down, hence pushing prices lower. Think of this as an obstacle to move higher.
Step 2
The Support at the bottom of the chart slightly moves higher, hence pushing prices higher. Think of this as an obstacle to move lower.
Step 3
Price is forced to move in a very tight channel and, just like in the real world when something is forced into a tight space, upward pressure builds up.
Step 4
An upward explosion takes place determining a massive and sudden breakout.
 BTCUSD 60m – April 2018 (with Levels and Zones indicator and comments)
When you have an indicator like the Levels and Zones, it is easy to identify when and where the pressure is building up and situations like the one described above occur every single day in the Market. For instance, the following is a similar situation on EURUSD in January 2018.
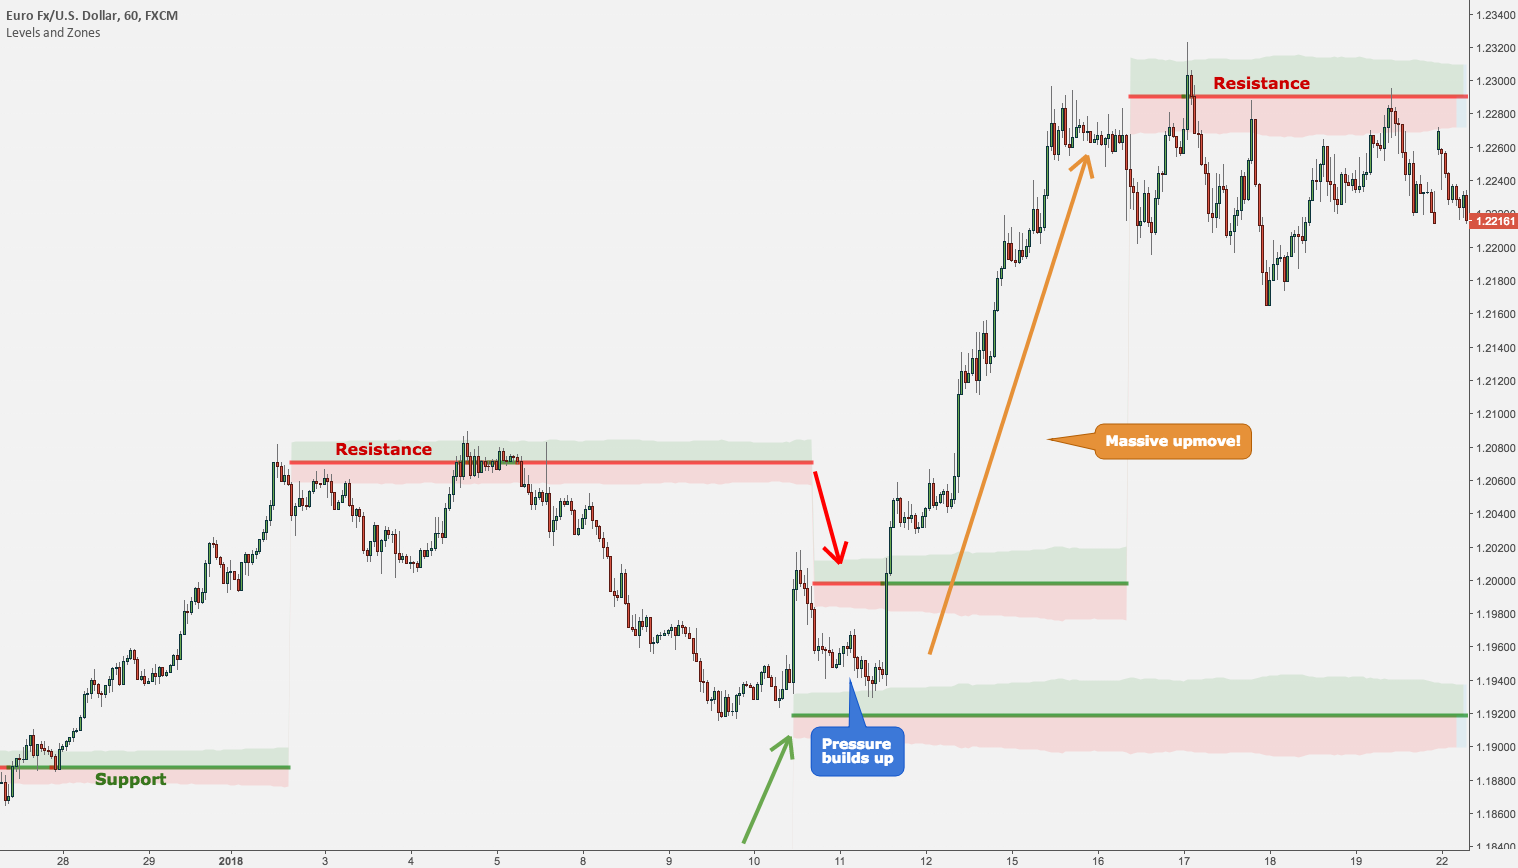 EURUSD 60m – January 2018 (with Levels and Zones indicator and comments)
The situation is almost identical to the setup analysed above and, in this case, pressure blows off into a 300 pips movement which is not as sudden as the one on BTCUSD but it is still an impulsive movement so, in a relatively short amount of time (x-axis), you get a very significant price fluctuation (y-axis).
Being able to consistently identify situations where big movements are about to happen can turn a choppy track record into a very profitable performance over the long term.
The Levels and Zones was developed exactly for this: to predict Market moves by identifying the most significant levels where price is likely to bounce, stop or break.


