
3 Trading Setups with the
Bottoms Tops Signal Toolkit
What if you know 3 Trading Setups with some of the best indicators for TradingView, used every single day by many day traders and swing traders for their technical analysis and trading activity?
Our Bottoms Tops Signal Toolkit is the combination of the Bottoms Tops Signal and the RSI Exhaustion.
This combination is not only very simple to read but it is also extremely powerful by offering a full variety of trading setups which can be easily integrated into multiple strategies.
The good news?
You will be able to exploit these 3 Trading Setups straight away on any asset and on any timeframe.
But that’s not all!
In fact, one setup does not exclude the other! Once you learn these 3 Trading Setups, you can easily switch between the setups depending on the specific situation you see on your chart.
So, let’s discover them by starting with the first.
Setup 1 –
The first setup is a very popular one and allows you to identify only the best opportunities the Market has to offer by exploiting the Bottoms Tops Signal and the RSI Exhaustion.

As you can see from the chart above, there are several Bottoms and Tops opportunities on this ETHUSD 60m chart. However, among those, there are two big opportunities (circled in blue) which have the highest probability and the greatest returns.
Of course, many traders exploit even the other Bottoms and Tops but as you can see from the chart, they offer minor opportunities in respect to the two circled.
So, how to identify only the best and most likely?
It’s very simple because it takes just three simple rules!

BUY rules (example)
- A Bottom appears
- RSI grows with the price (see how the two blue trend lines that we draw have the same slope)
- RSI is Exhausted
What we see in the situation above is that a Bottom gets identified and the RSI is progressively growing with the price meaning that the up-move can be supported. Finally, the RSI becomes bear exhausted (coloured in red) which means that the price doesn’t have much more room to go down.
Every time you see these three conditions, you are sure to have a very likely big opportunity!
The second opportunity is even better.

SELL rules (example)
- A Top appears
- RSI and the price have a big divergence (see how the two blue trend lines that we draw have opposite slopes)
- RSI is Exhausted
What we see in the situation above is that a Top gets identified and the RSI forms a divergence with the price meaning that the current price level is not sustainable. Finally, the RSI becomes bull exhausted (coloured in green) which means that the price doesn’t have much more room to go up.
With three simple rules, out of multiple Bottoms and Tops, you are now able to identify only on those opportunities which are most likely and offer the greatest return.
Setup 2 –
The second setup is less frequent but very powerful especially when you want to identify and exploit major shifts in the Market.
The following chart shows the EURJPY pair on a daily timeframe.

As you can see straight away, almost every Market extreme was correctly identified by the Bottoms Tops Signal either with a Top or a Bottom so you could have exploited those opportunities right away.
But there’s a lot more.

The pair has been in a big downtrend until around mid-2016. Then it entered in an upward consolidation which lasted for about a year until it finally took off in Jun 2017.
What happened in June, right before the take-off, is the setup you are about to learn.
Even in this setup, there are a few simple rules which create the opportunity, so let’s see them.
Major shift rules (example)
- RSI goes oversold (or almost) and is bear exhausted (coloured red)
- RSI goes overbought (or almost) and is bull exhausted (coloured green) + New high
- RSI goes bear exhausted again around 50 + Bottom
So, what happens is that the RSI first makes a peak down becoming oversold and simultaneously exhausted. Then it makes a new peak on the opposite side by becoming overbought and simultaneously bull exhausted. Lastly, it goes down again to around 50 and becomes bear exhausted while a new bottom appears.
The situation above is indicative of a very major move in the Market, in fact, since that moment the EURJPY gained almost 1500 pips until the end of the year.
It is a situation appreciated by Elliott Wave traders because this setup is able to identify Wave-3 and Wave-5 which, in Elliott Wave theory, are notoriously the most profitable and less risky.
Setup 3 –
The third and last setup is for those traders who keep an open mind and see things differently.
In case of major trends, the Bottoms Tops Signal might identify several opportunities which then get invalidated by the Market because the price keeps pushing in the same direction.
Every professional trader knows a simple quote
So why going against?
For this setup, we need to be sure to have the “Suggested Close” icons visible on our chart. To do so, simply go into the Settings of the Bottoms Tops Signal and then be sure to enable “Show Suggested Close” under the Inputs tab.

Once you enable it you will see X signs appearing on your chart (for the sake of this article we made them very big in the chart above).
The X signs represent the suggested close so, for instance, considering the first X in the chart above, if you took the bottom just before it, you should close your position when the X appears.
However, the opportunity was rather small and the others even led to losses.
So what can you do?
You know that we are in a downtrend because we had a Top (on the left of the chart) and the price has been falling since so, instead of taking the Bottoms trying to fight the trend, you take the suggested closes of those Bottoms like they were Top opportunities.
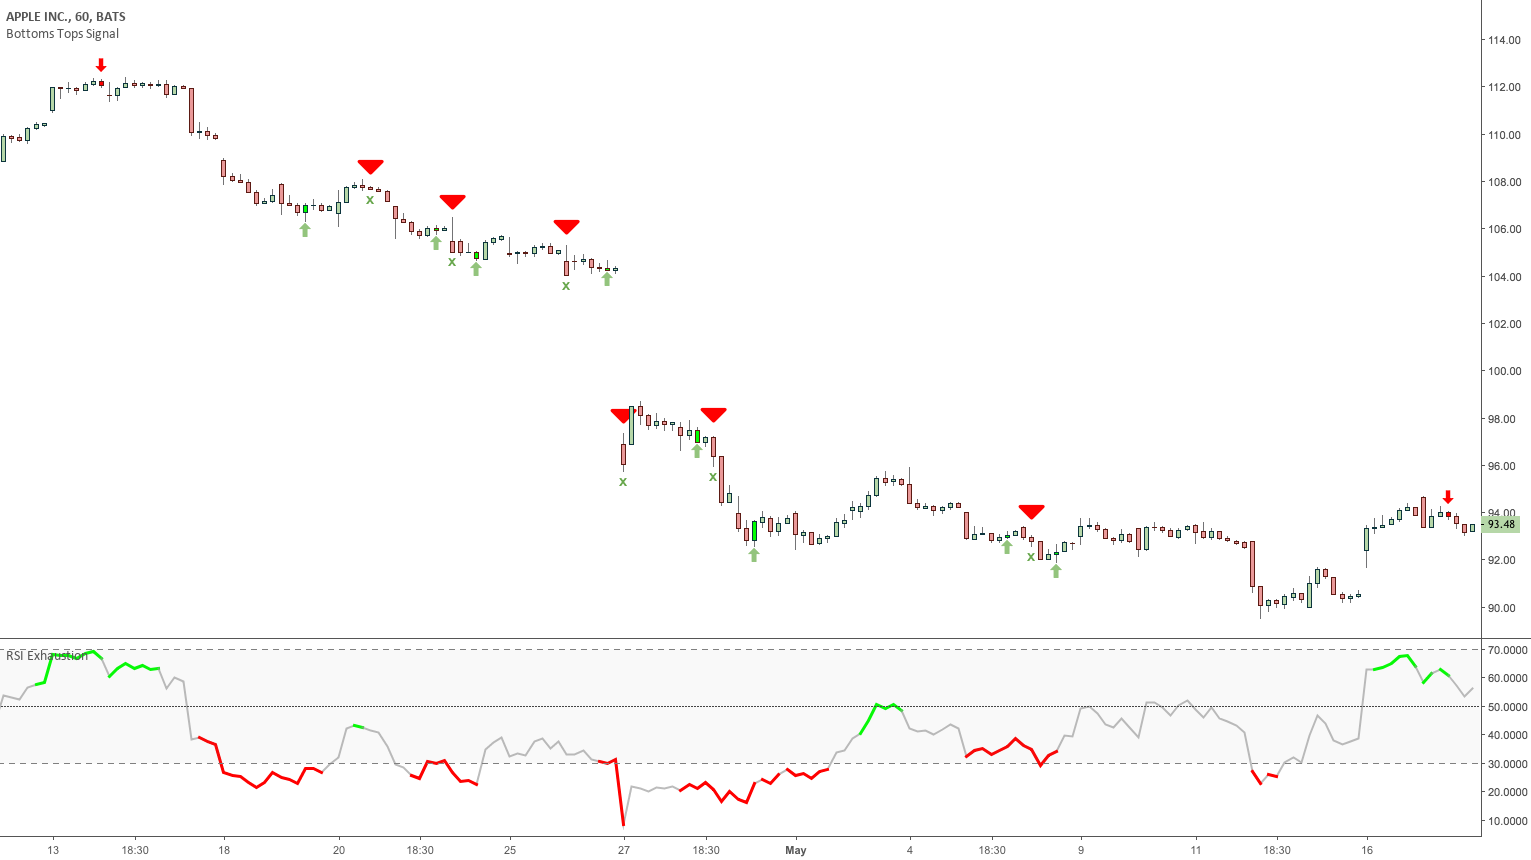
In the chart above we highlighted the opportunities with red triangles just above the candles with the X.
As you can see, you can turn a very unfriendly trend into a very profitable run down by exploiting each of the six opportunities (or the ones that align with your strategy).
But there’s even more to tell.
This Setup is a very safe approach to trading the Markets for two reasons.
First, because you trade only when you have enough evidence: there was a Top and the price has been falling since so, we are clearly in a down-trending bearish market.
Second, because it is extremely likely that the last Bottom in the downtrend will not be invalidated (like in the chart above).
What does this mean?
It means that you will not take a new position when the trend is ending and you will preserve your account.
Essentially, you ride the trend all the way down (or up) until there is room to go. Then, you wait for a new extreme to appear, a new trend to form and new opportunities to be exploited.
You just learned 3 Trading Setups with the Bottoms Tops Signal and the RSI Ehxuastion that are profitably exploited every single day by many fellow traders on TradingView.
Of course, the more you use the indicators, the more you will learn to identify those setups and even define new ones according to your strategy.
We regularly receive feedback from fellow Traders who exploit our famous indicators in new creative ways.
If you are among those, feel free to contact us and we’ll be happy to create a new article around your setup and share it back with the whole trading community.


